

Contents
‘Big Data’ is a huge trend in technology today, and AWS has many offerings that allow you to perform complex data analyses. The goal of this article is to introduce some of the very basics of Big Data in AWS. There are many ways to store, query, and visualize data in AWS, but I’ll focus on just a single configuration that utilizes S3 (storage), Glue (metadata catalog), and Athena (query engine). I’ll introduce each service with the bare minimum amount of information you need to get started and then dive right into building a working example. We’ll upload data to S3, catalog it using Glue, and run queries against it using Athena. If you’re familiar with working in the AWS Console, you should be able to have the whole thing up and running in 15–20 minutes.
S3
S3 is often the core of a big data solution on AWS. S3 offers near-unlimited scalability, is very cost-effective (compared to other storage solutions on AWS like EBS), and tight integration with AWS’s other big data tools. Using S3 as your data lake (a common term used to describe a centralized repository for your data) allows you to decouple your storage and compute resources — scaling one doesn’t require scaling the other. You can add as many users as you want to the client-side of your system (query and data processing) without worrying about anything on S3; it will continue to offer the scalability you need and you’ll just pay for the additional read/write usage.
Glue
Unfortunately, uploading all of your data into S3 won’t immediately allow other AWS services like Athena or Redshift Spectrum to access it. Those tools need more information about your source data — where is the data stored, what file formats is it stored in, and what the schema of that data? Rather than define all of that information yourself and configure each client manually, we’ll use the aptly named ‘AWS Glue’ service to do that work for us. AWS Glue allows you to create a ‘crawler’ that inspects all of the data in an S3 bucket, infers its schema, and records all relevant metadata in a catalog. Other services in the AWS ecosystem can reference Glue’s catalog to quickly and easily integrate with your source data source.
In this tutorial, we’ll only use the basic functionality of Glue as described above, but the service does offer a lot more. One of Glue’s more powerful features is to define and execute ETL jobs (Extract-Transform-Load.) These jobs are typically used to take input data from an S3 bucket (for example, raw logs of customer API usage), transform that data into a format that fits analytics usage (perhaps convert to a columnar format like Parquet, sanitize or filter records, or remove duplicates), and load that data into another storage location for your analytics services to query(another S3 bucket or a different AWS data store.)
Athena
AWS Athena is a serverless tool that allows you to query data stored in S3 using SQL syntax. Under the covers, it’s an AWS managed version of the open-source Presto tool, a distributed SQL query engine originally developed at Facebook for their data analysts to work with massive data sets. Athena can query data in parallel where it is stored, without first moving it to a separate location for analytics processing. This allows most queries to be executed in a matter of seconds, even for very large data sets.
There’s a lot more to discover about each of these services, but as I mentioned earlier, we’ll stick with a very basic introduction and then start building on AWS. So let’s get started! Upload Sample Data to S3
In a typical business analytics use case, there might be a constant stream of data from applications into an S3 bucket. To keep this example simple and focused on the tools we’re interested in, we’ll just upload our source data directly to S3. We’ll also skip the ‘Big’ in Big Data and use small files to ensure that anyone can complete this tutorial without spending much money to transfer sample data into S3.
Actually, for this part of the tutorial, you could use any data you like in a format that AWS Glue supports (these include CSV, JSON, XML, Parquet, and many others.) You would just need to alter the queries in later steps a bit to match your input data.
In keeping with the times, we’ll use data from the Novel Coronavirus Visual Dashboard operated by the Johns Hopkins University. You can download the files straight from GitHub, or clone the repo onto your local machine with this command:
Now that you have data on your machine, we need to upload it to S3. You can do this on the command-line with the AWS CLI if that’s your jam, or you can do it in your browser via the AWS Console (I’ll walk through that method now.)
Head to the AWS S3 Console and create a new bucket to store the source data (my bucket is named medium-covid-data.) Next, we’ll create a folder structure within our S3 bucket using Apache Hive naming conventions. Doing so will allow AWS Glue to recognize each folder as a partition, so that when we query the data with Athena, if we specify “WHERE year = 2020 and month=4” we’ll immediately filter out all data that’s not in the April 2020 folder. This provides a massive increase in performance (and a decrease in cost per query) when there are many large files spread across many folders.
The Hive convention is {name}={value}, so our folder structure will be year=2020/month=4. With larger data sets, you might want even more partitions, down to the day, hour, minute, or even second level. The partition names and values can be anything, not necessarily based on timestamps; for example, if you were storing API request logs, you might have a top-level folder structure of “api=geocodestop, api=routereport, etc.)
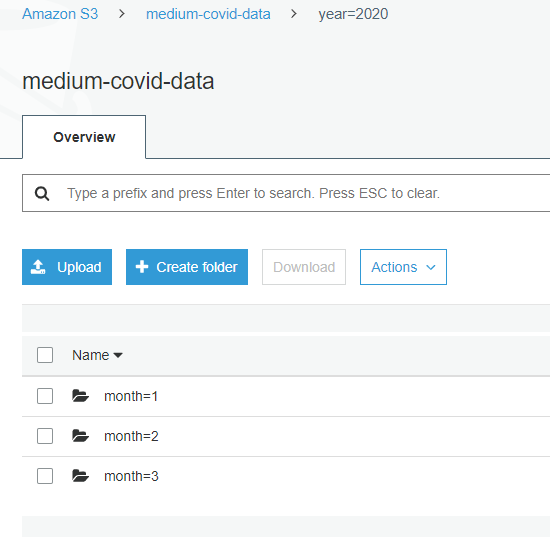
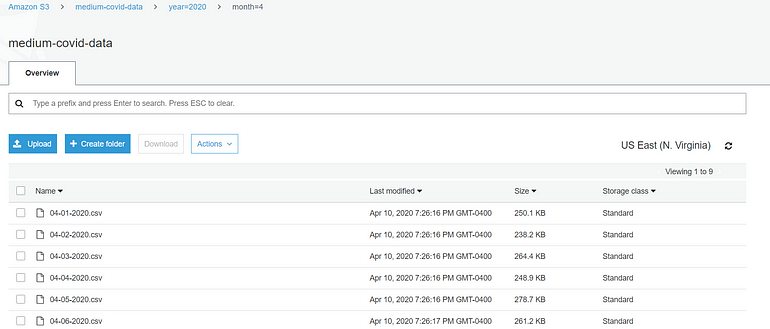
Once you create the folder structure, go ahead and upload some of the .csv files from your local {cloned_repo}/csse_covid_19_data/csse_covid_19_daily_reports directory. Each .csv file is named for the date of the report, so make you upload them into the correct folders (03–25–2020.csv goes in the year=2020/month=3 folder.) The easiest way to do this is to navigate to each ‘month’ folder, then click the ‘Upload’ button in the upper left, and then drag and drop multiple files at once into each folder.
Glue — Create a Crawler
Now that our data is in S3, we want to make it as simple as possible for other AWS services to work with it. This is where AWS Glue comes into play. We’re going to create a ‘crawler’ to scan our S3 bucket. The crawler will identify the partitions we created, the files we uploaded, and even the schema of the data within those files. Glue is a very powerful tool with a lot of features; we’ll stick with just the basics for this tutorial. Navigate to the AWS Glue Console to get started.

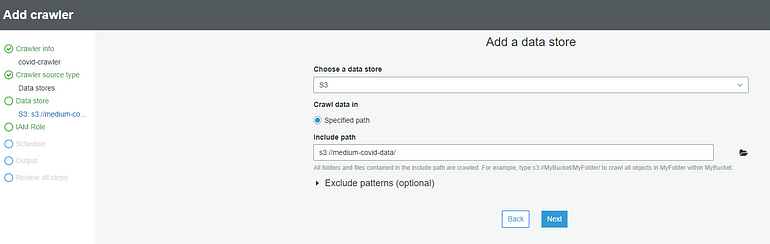
Select Crawlers from the menu on the left, and then ‘Add Crawler.’ Name your crawler whatever you like, select ‘Data Stores’ when asked for the source type, and then select S3 as the data store. For the ‘Include Path’, specify your S3 bucket in the s3://bucketname/ format.
When asked about a second data store, select No. When asked to choose an IAM role, create a new one with any name you prefer. The ability to run the crawler on a schedule is a useful feature; if data is constantly being uploaded to your S3 bucket, you’ll want the crawler to run at least whenever new partitions are created. For our example, it’s fine to choose to run it on-demand only.

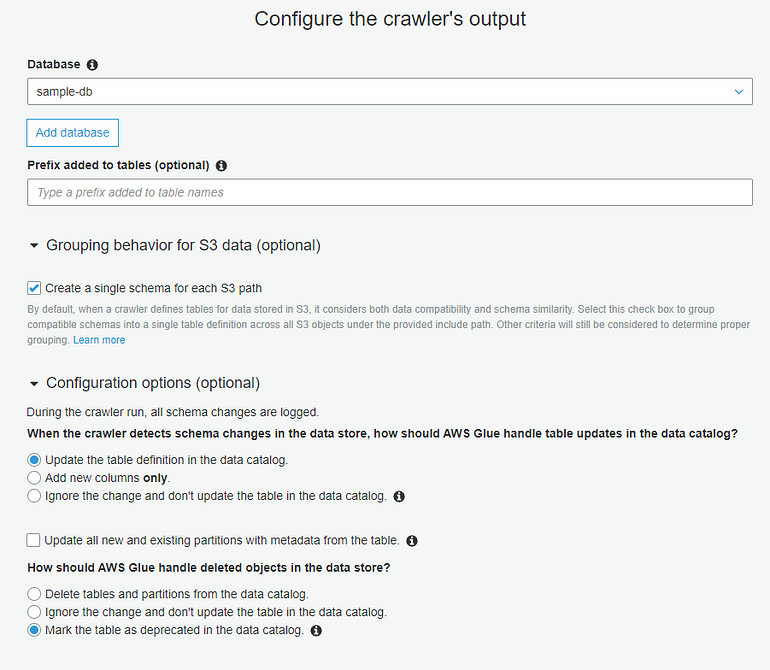
We need to configure the crawler’s output. The crawler will scan our data and create a table (with schema), but it needs a database to write that table to. Select ‘Add database’ and provide a name. Then, expand the ‘Grouping behavior for S3 data’ section, and enable the ‘Create a single schema for each S3 path’ option. Because all of our source data will have a consistent schema regardless of the S3 partition path (the April data is the same format as the March data), we want a single table that represents all of our source data. You can leave the default values for the other configuration options.
That’s it! Click through to create the crawler, and then when you’re returned to the main view, click ‘Run it now?’ to kick off your crawler for the first time.
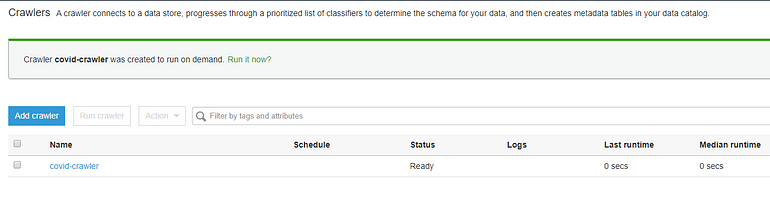
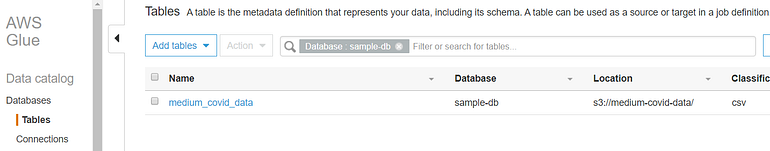
The crawler may take a minute or two to execute. When it’s complete, navigate to Tables (within the Databases section of Glue.) Here you’ll find the table that the crawler generated. If you see many tables, you probably didn’t check the ‘Create a single schema for each S3 path’ option when you set up the crawler. If so, you can delete all the tables, edit the crawler to enable that option, and then run the crawler again.
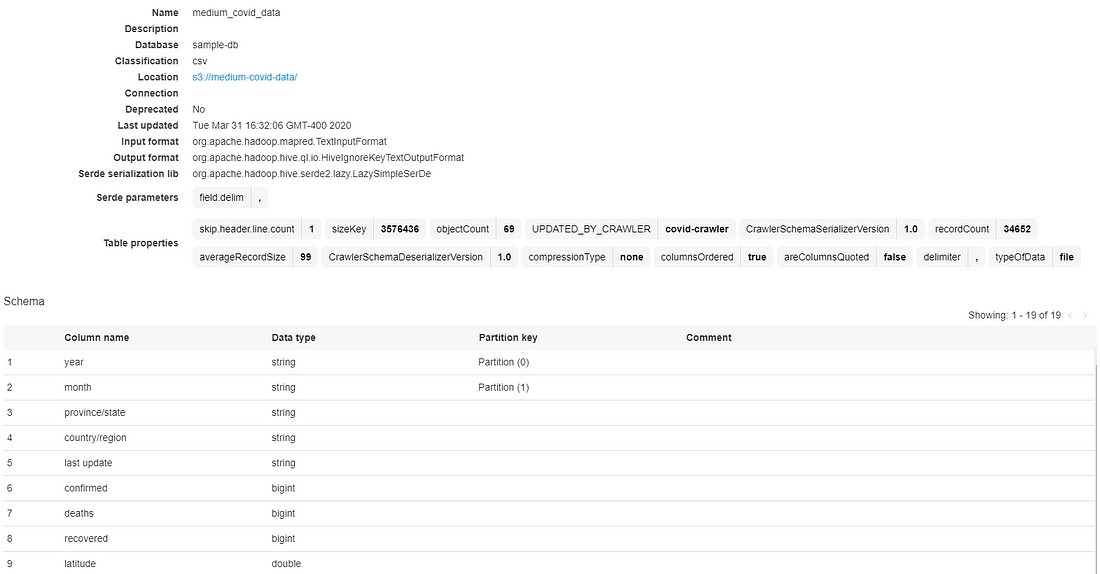
Select your table to view its properties (such as objectCount, recordCount, and averageRecordSize.) Below those properties, you’ll find the schema that the crawler identified by parsing the source data. Note that for the year and month rows, Glue correctly identifies them as partition keys (because of the naming convention we used.)
Query the Data with Athena
Now that Glue has crawler our source data and generated a table, we’re ready to use Athena to query our data. Navigate to the AWS Athena console to get started.
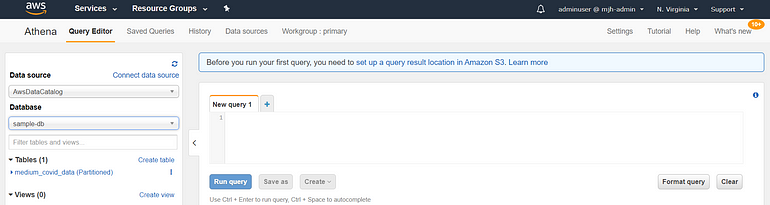
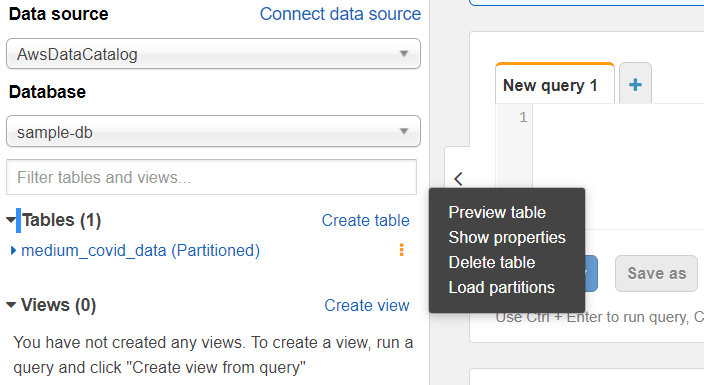
On the main page of the Athena console, you’ll see a query editor on the right-hand side, and a panel on the left-hand side to choose the data source and table to query. Select the AwsDataCatalog as your data source (this may be the default option) and then select the database you created while setting up your crawler (mine is called sample-db.) Now, in the ‘Tables’ section, you should see the table your crawler generated (mine is called medium-covid-data.)
Let’s execute our very first Athena query. Click on the three dots next to your table, and from the popup menu, select ‘Preview Table.’
Uh-oh. That query failed with the error below:
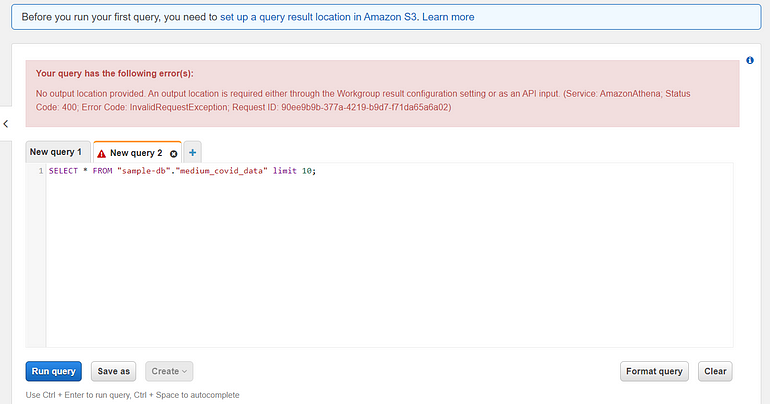
It seems we haven’t defined where Athena should store the results of the query within S3. Luckily, Amazon expected us to make that mistake and displays a helpful tip near the top of the screen. Select that (or click the Settings button in the top menu bar) and type in a new S3 bucket location (I entered s3://covid-athena-results/). Then run the preview query again.
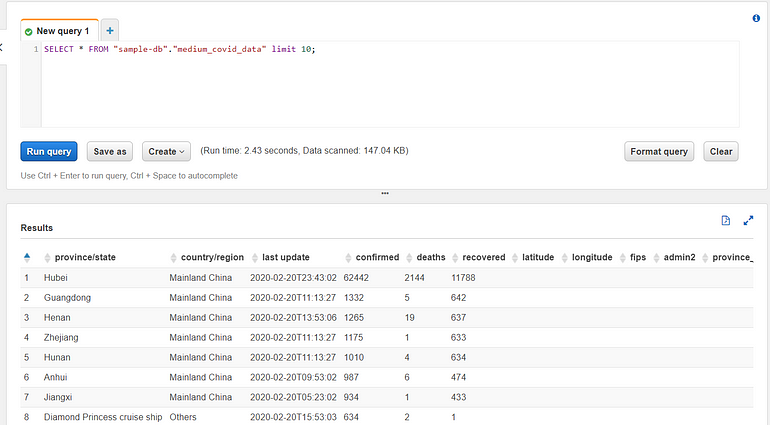
There are a few interesting fields in the results view. Two very important numbers are displayed alongside the ‘Run Query’ button: the runtime of the query and the amount of data scanned. AWS Athena usage is billed per query depending on how much data is scanned. This is why creating partitions is so important.
Let’s write another query now. Let’s say we want to find all the records where the number of recovered is greater than the number of deaths. Because Athena uses a SQL-compatible language, this is easy to express (just remove the ‘limit 10’ from the preview query and add ‘WHERE recovered > deaths.)
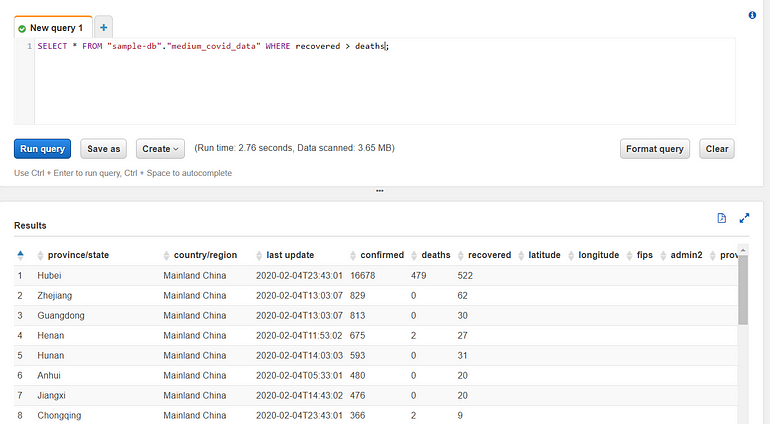
View the results, and notice that the query scanned 3.65MB of data. That is actually all of my source data — every single record. I can verify this by doing a ‘SELECT * FROM {source}’ and see that it scans the same amount of data. It scans all of the data because we aren’t utilizing any partitions for this query. This is the type of slow, expensive query you’ll want to avoid if you’re scanning massive amounts of data.
Let’s try a more interesting query and determine the provinces or states that reported any deaths in January 2020. The syntax and results are below:
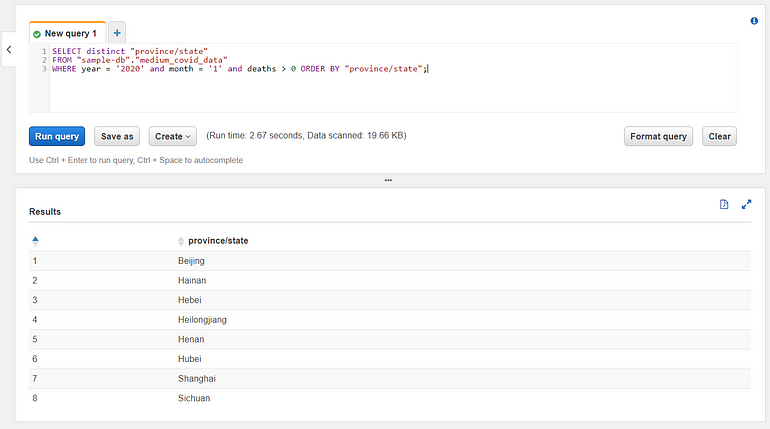
To generate these results we only scanned a fraction of the total dataset thanks to the effective portions. AWS Athena has full standard SQL support, so you can use all your favorite SQL tricks to query your data. Get creative and try a few of your own queries. Using the Athena Cost Estimator, if we run 10 queries a day, and each query scans 1 GB of data, our monthly cost will be only $1.45. In a true ‘Big Data’ scenario, we’d have much more data of course, but this pricing allows us to learn how to use Athena without spending much money.
What’s Next?
With this system running, you can expand on it to suit your needs. Upload a larger dataset, or use a tool like AWS Kinesis to stream data into your S3 bucket. Configure Glue to run on a schedule (maybe daily or hourly to track newly created partitions.) Create an ETL in Glue, to transform your source data and write it to a new S3 bucket. Try out another service like RedShift Spectrum that can also run queries directly against an S3 bucket. If you’d like to visualize your data, AWS QuickSight fits into this architecture nicely and is rather easy to use. Please let me know in the comments if there’s anything specific you’d like me to dive deeper into. Thanks for reading!
Share this article: