

Contents
A developer has finished writing their code, all business requirements have been met and the test suite is showing all tests as passing.
After pushing the changes to a QA or production environment, everything seems good so far, until the developer starts getting reports that operations peripherally or directly linked to the feature are showing a marked decline in performance. Either too many resources are being used to process the solution, or its addition is overburdening the available computational resources.
An executive decision is made to revert all developer changes until the catalyst for the performance degradation can be identified and resolved. This is something every developer tries their best to avoid, but it can happen in spite of all the best efforts and practices.
If this situation sounds familiar, or if you have been proactive in your development, then you may have already ran into one of the more useful tools provided by Microsoft Visual Studio: the Diagnostic Tools window. While Microsoft and others offer great tutorials on the basics of using this set of tools, we want to zero in today on using it to actually identify performance bottlenecks and potential optimizations.
For the sake of simplicity, we’ll be working with a single-threaded program that acts as time attack shell for a movie catalogue class.
This shell consists of a relatively large number of calls to find movies for a given genre and year range. The idea is to get an estimate of how long it would take to complete a few movie queries under different scenarios.
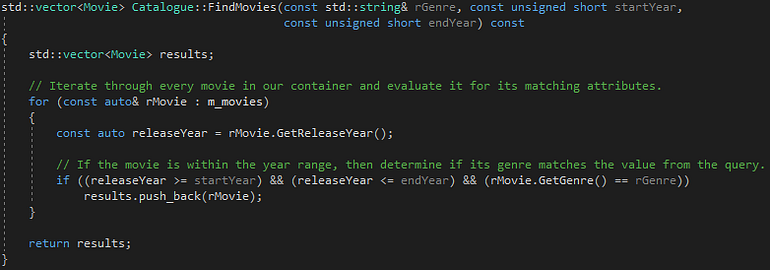
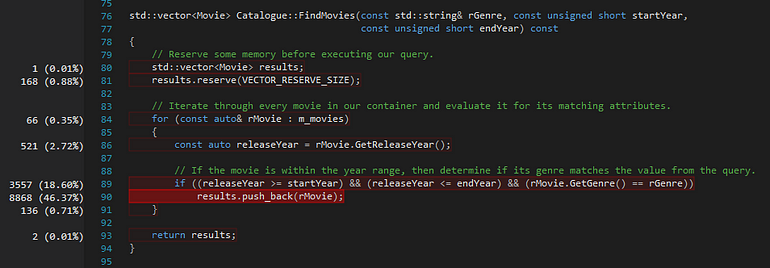
The Movie class defines what the movies in our catalogue look like, requiring an identifier, a name, a genre and a release year. The Catalogue class on the other hand acts as a container of Movie objects, and is responsible for both loading our metadata from disk and handling movie queries. Let’s take a closer look at what this query function looks like:

Catalogue’s Find Movie function.
Based on the function declaration, we are searching for movies based on a given genre as well as a time frame, and returning a vector of movies that match those parameters.
For example, if our catalogue had the following entries:
- Star Wars, Drama|Adventure, 1977
- Toy Story, Children|Adventure, 1995
- The Shining, Drama|Horror, 1997
- Ratatouille, Children|Drama, 2007
Then making a query for Drama movies between 1980 and 2010 should yield:
- The Shining, Drama|Horror, 1997
- Ratatouille, Children|Drama, 2007
With that in mind, our rudimentary query function looks something like this:
Based on this design, it’ll take an average of O(n) time to find the movies we are looking for since we are traversing the entire collection every time we perform a query. Let’s see how long it takes to execute our time attack with a catalogue made of 43,231 different movies.
Beginning time attack…Genre: Drama
Time spent: 17.311
Genre: Children
Time spent: 1.748
Genre: Comedy
Time spent: 17.816
Genre: Action
Time spent: 12.334
Time attack complete!
While the numbers are not exactly ideal, this establishes a baseline to work off from so program profiling can begin.
Remember when doing profiling and optimization work that it is important to have a baseline in order to estimate the impact of the changes that you may introduce as a result of your optimization work. Furthermore, its especially critical to have a robust test suite in place in order to ensure that the program remains healthy throughout any and all changes. There’s no point in making a program twice as fast if it comes at the cost of failing valid use cases.
With a baseline in hand, let’s take a look at the diagnostic tools provided by Visual Studio and see if they can help us identify any ‘performance knots’ in our program.

If the window is not automatically loaded, you can find it under Debug -> Windows -> Show Diagnostic Tools The diagnostic tools window has options to profile both memory and CPU usage. For our purposes we’ll be focusing on the CPU usage component, so we’ll toggle Record CPU Profile on and leave Heap Profiling off.
At this point in time, we are only interested in the time attack portion of our program, so we are going to set a pair of breakpoints that encapsulate this execution frame. This will make it easier to later reduce the noise from functions and operations we are not interested in by creating events we can anchor our time frames on.
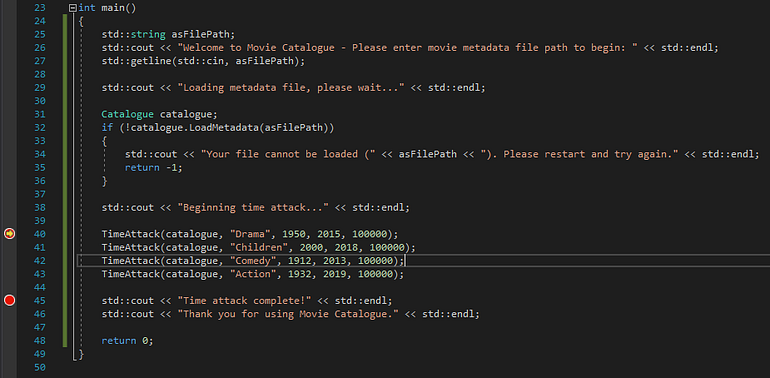
With our breakpoints in place, we can start our program. After loading the catalogue metadata the first checkpoint is reached; in the diagnostic tools window you should be able to see the events and graphs representing our start up sequence.
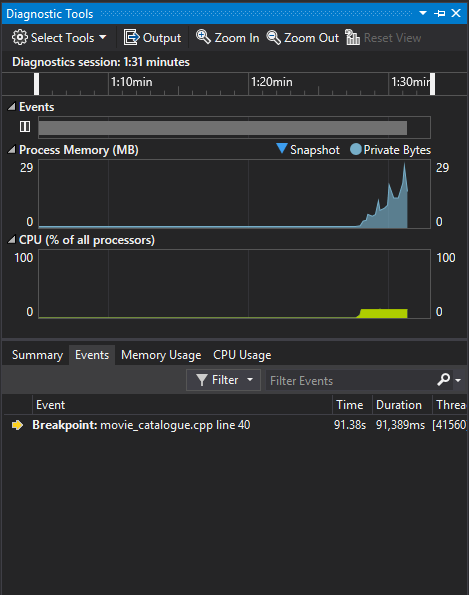
Since we are not interested in this particular frame, we’ll just continue on to our next breakpoint. It should show up on the events tab of our diagnostic tools window after we reach it. Clicking on it will automatically set the time frame between itself and the last event (which was our initial breakpoint event), allowing us to inspect the time attack portion in detail.
Clicking on the CPU Usage tab will show you a table of all the functions called within our time frame, tagged with the number of CPU cycles it took to complete them.
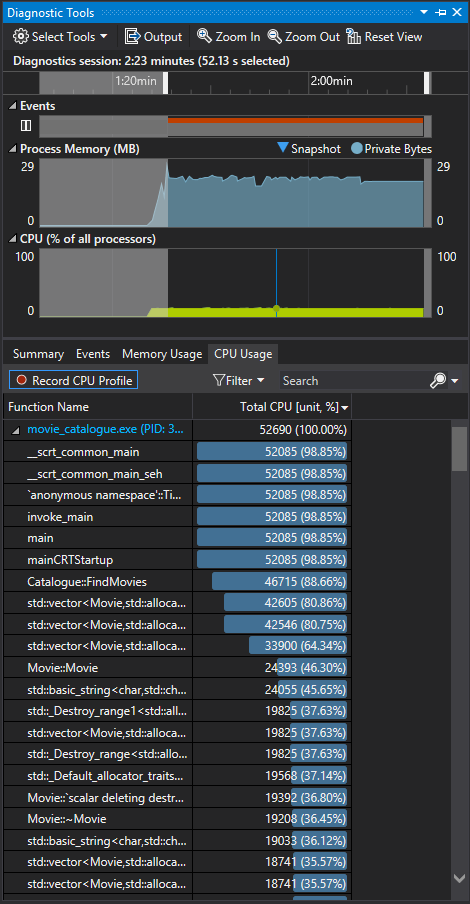
Please note that these values are aggregates, meaning that they represent the total amount of cycles used between all the combined calls to the given functions and procedures. Taking a closer look, you can find the Catalogue::FindMovies function within the given list, which is not surprising since that’s essentially all that is happening within the given frame, taking 46715 cycles to complete. Clicking on any of these entries will take you to a new window, which has a breakdown of the CPU usage within the function’s frame.
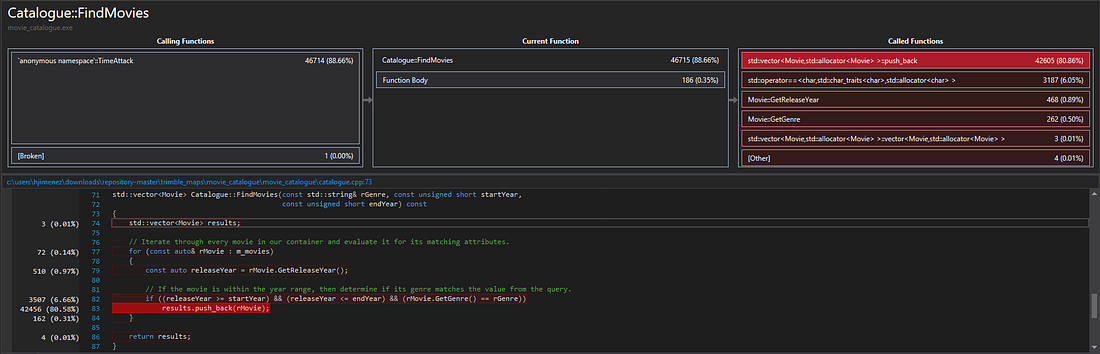
On the top right you have a breakdown of the CPU utilization within the frame, clicking on any of these will take you to a window just like this one for whatever operation you clicked on.
Initial conjecture may have led us to believe that the naive brute force approach for our query would had been a major contributor to our CPU usage, but decomposing the results displayed in usage window we can see that pushing back records to our results vector seems to be the actual culprit.
Digging down further by clicking on vector::push_back and the vector::emplace_back functions in the called functions window, we are able to glean that most of that time was spent reallocating the records in our vector.
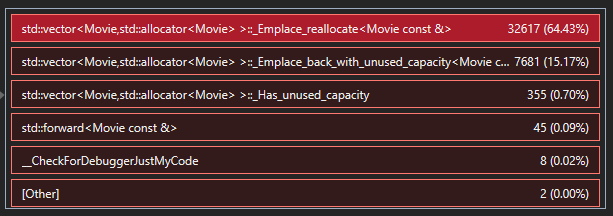
Objects in vectors are stored in contiguous chunks of allocated memory. Whenever an object is inserted into a vector and the allocated memory is not large enough to contain all objects, a new and larger chunk of memory is allocated. All records are copied from the old chunk of memory to the new one, which can be an expensive operation.
Now that we have identified which function is causing issues, we can begin developing solutions to limit its impact in the overall execution of our program. What those solutions entail differ from project to project, and from problem to problem. This may sound obvious, but it’s important to keep in mind both the requirements and your level of comfort when doing changes within any piece of code.
For our particular scenario we are most definitely not going to be modifying anything in the C++ standard libraries, and assuming we are not allowed to change the function declaration, we are not changing what the return or input values are for our FindMovies function either.
This limits our scope to the logic within the FindMovies function and the Catalogue class itself. We know that vector reallocation is taking a good chunk of our execution time. An easy solution could be as simple as reserving some memory before starting our query. This will reduce the amount of re-allocations the program performs whenever the vector’s memory size is exceeded.
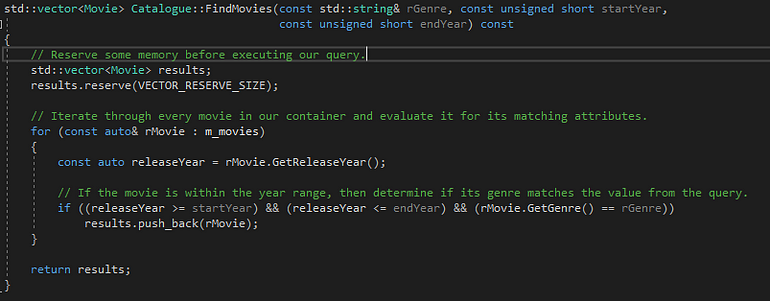
For this example, I set the reserve size arbitrarily at 10000 records.
With this change in place, lets run our time attack again and see how it changes our execution times.
Beginning time attack…Genre: Drama
Time spent: 6.011
Genre: Children
Time spent: 1.267
Genre: Comedy
Time spent: 6.107
Genre: Action
Time spent: 4.517
Time attack complete!
Much better. Time to completion has been cut to roughly one half of the original values across the board. Let’s take a look at the CPU usage window.
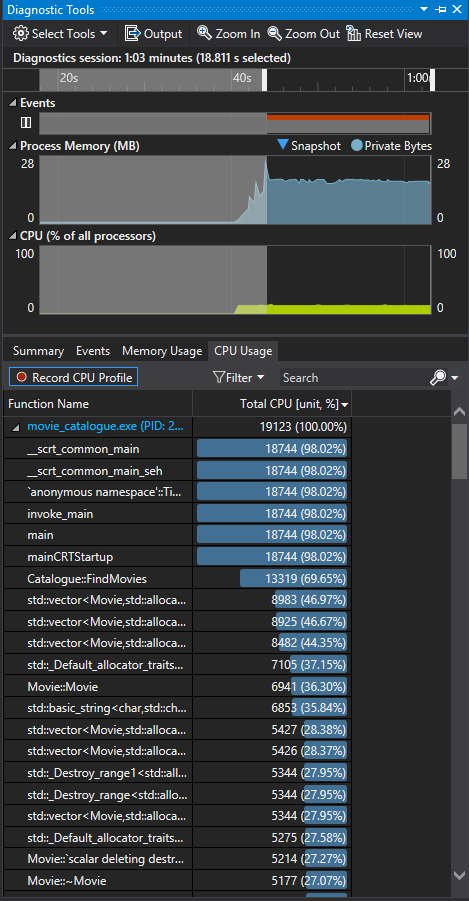
Once again, Catalogue::FindMovies is taking the bulk of the execution time, but the amount of CPU cycles spent resolving it has gone down to 13319, roughly 30% of the cycles it took us to complete this initially. Expanding the profile for the FindMovies function you will notice that while push_back remains a main contributor to CPU usage, some other calls within the function are now showing more prominence.
Based on this new snapshot we can now see the impact of the brute force design more clearly: signified here by the 3557 cycles spent comparing the attributes of each movie.
This is a pattern that is common when doing optimization work. Fixing one piece of logic can lead to a cascade of effects and trade-offs in other pieces of your program, uncovering other ‘performance knots’ whose impact may have been obscured by more prominent issues.
Given this new information, we could begin taking a closer look at the design of the Catalogue class itself, particularly in how we store and access the Movie records we collect, but I’ll leave that part for you to explore and experiment on your own time and leisure.
Learning how to profile has and continues to be a highly useful skill to have as a developer; it is just not enough to arrive at correct solutions, we frequently also need to achieve them using the least amount of resources possible.
Familiarizing yourself with a set of diagnostic and profiling tools, such as those presented with Visual Studio, can help achieve these goals by giving you more visibility into the inner workings of your solutions, helping pinpoint problems, and reducing time spent optimizing code by identifying the ‘performance knots’ within.
Share this article: