

Contents
Transparency into production systems is essential to site reliability. Enormous transparency can be achieved simply by turning on load balancer logs then writing a query to measure the health and stability of every service all at once. I will demonstrate this later.
First, let’s understand why logging at the load balancer is important, compared to logging directly from the service or from the application itself:
- Load balancer logs are decoupled from backend code. If the backend process fails, the load balancer still continues logging requests. We may be blind to changes in error rates if we are reliant on backend logging exclusively.
- Load balancer logs are consistent across applications and services. Therefore, our analytics systems can parse them in the same way with the same simple code snippet.
- Load balancer logs capture the most salient health metrics: the API being called, the response code, and the processing time. We should not need to write backend logging to capture these metrics. We don’t trust custom logging when we don’t have to.
- Load balancer logs have no bugs. Our application logging will have bugs. We don’t want custom logging. That’s why logging at the load balancer is important. Logging from backend services can also be useful if detailed and targeted logs, which only the application can provide, are needed. But that’s different than logging for generic application or service health and stability, which is what we’re here to do.
Key Metrics We are Interested In
Item 3 above shows that we can get a few key metrics from load balancer logs. With this data we can paint a detailed story about the health and stability of a service. Here are the outputs:
- Request count: how many individual requests the service is handling.
- Median response time: median response is a good measure of the typical performance of a service. Definitely stop looking at averages. Averages are full of lies — see more below.
- 99.5% response time: the time within which 99.5% of all requests process. We must worry about our tail. This number is commonly many times higher than the median number. Understand why this is, then work to reduce this number closer to the median. Now your service will be significantly more scalable and you will have proactively prevented many incidents and outages, some of which you might not realize are already occurring.
- Max response time: the single slowest response time. We must know what the very worst outlier is all the time. If this case were to become common, our service would likely fail.
- Total responses over 1 second: anything that takes more than 1 second to process is essentially not scalable. 1s is arbitrary, but it’s a good initial line to draw. We should not have many response times exceeding 1 second.
- Total 5xx response codes: 5xx responses indicate fatal results, like unexpected timeouts or crashes. An ideal system will have zero 5xx responses.
- Performance success rate: the percentages of requests processed in less than 1 second (or your own arbitrary ceiling).
- Response success rate: the percentage of requests not returning 5xx codes.
In summary: first, for performance, watch your tail. Not your average.
If you run a web service with an average latency of 100 ms at 1,000 requests per second, 1% of requests might easily take 5 seconds. (If 1% of your requests are 50x the average, it means that the rest of your requests are about twice as fast as the average. But if you’re not measuring your distribution, the idea that most of your requests are near the mean is just hopeful thinking). If your users depend on several such web services to render their page, the 99th percentile of one backend can easily become the median response of your frontend
Second, for error rates, establish and hit a success rate objective of 99.99%. This would mean that less than 1 in 10,000 requests produce some kind of error. That’s usually a good start and it’s fun to brag about. To get there, the right architecture is essential, but that alone won’t suffice. You must also…
Monitor → Fix → Repeat.
How To
In our specific case we are using AWS ELBs for load balancing and SumoLogic for logging and analytics. Those choices are incidental and non-essential — other load balancers (e.g. nginx) and logging systems (e.g Splunk, New Relic) would work too. And by the way, we found and fixed five defects based on the initial review of this information.
Here’s the recipe:
First, in AWS, Enable ELB logs to write to AWS S3, for every ELB you are running. They will write every 5 minutes at most.
Second, create SumoLogic collector sources to ingest these logs as often as possible. After a few minutes logs will start appearing. It’s best to also setup SumoLogic field extraction rules for ELB so your parsing is done ahead of the query.
Third, create a SumoLogic dashboard based on the following query:
_collector=”My Collector Name”
| num(requestProc+ba_Response+cli_Response) * 1000 as time_ms
| if (time_ms > 1000, 1, 0) as slow_responses
| if (elb_statuscode >= 500, 1, 0) as errors
| count as total_reqs,
pct(time_ms, 50) as time_ms_pct_50,
pct(time_ms, 99.5) as time_ms_pct_99_5,
max(time_ms) as time_ms_worst,
sum(slow_responses) as num_resp_over_1s,
sum(errors) as _5xx_count
by domain
| (total_reqs — num_resp_over_1s) / total_reqs * 100 as perf_success_rate
| (total_reqs — _5xx_count) / total_reqs * 100 as success_rate
| sort by total_reqs desc
| round (time_ms_worst)
| round (time_ms_pct_99_5)
| round (time_ms_pct_50)
If you didn’t setup field extraction rules, you’ll also need a parse command in there as a second line. I left it out so the essence of the query could shine through, but here it is if you need it:
| parse “* * *:* *:* * * * * * * * \”* *://*:*/* HTTP” as datetime,
ELB_Server, clientIP, port, backend, backend_port, requestProc,
ba_Response, cli_Response, ELB_StatusCode, be_StatusCode, rcvd, send,
method, protocol, domain, server_port, path
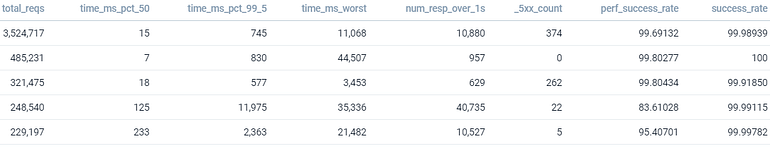
That small amount work produces this bountiful output. And it does so for every service which is part of this collector, not just one service.
SumoLogic output table. One row per domain in the ELB log.
SumoLogic output table. One row per domain in the ELB log.
This table immediately raises lots of interesting questions. E.g. Why is the top service called so many more times than the other services — is that expected? Why do services with very low median response times have worst case response times which are over 6,000X slower — what’s going on in the tail? Why is the third service not at 4 nines of success rate yet?
Finally, create a SumoLogic alert using essentially the same query to flag if error rates increase. That’s easy to derive from the query above.
Don’t Wait For Problems To Come To You
Ultimately, the goal is to Monitor → Fix → Repeat. Monitoring with load balancer logs is fast, easy, and cheap to do. Don’t wait for problems to show themselves. Aggressively expose then eliminate problems!
After all, today’s slightly escalated error rate is a usage pattern change away from being tomorrow’s outage.
Share this article: