Examples
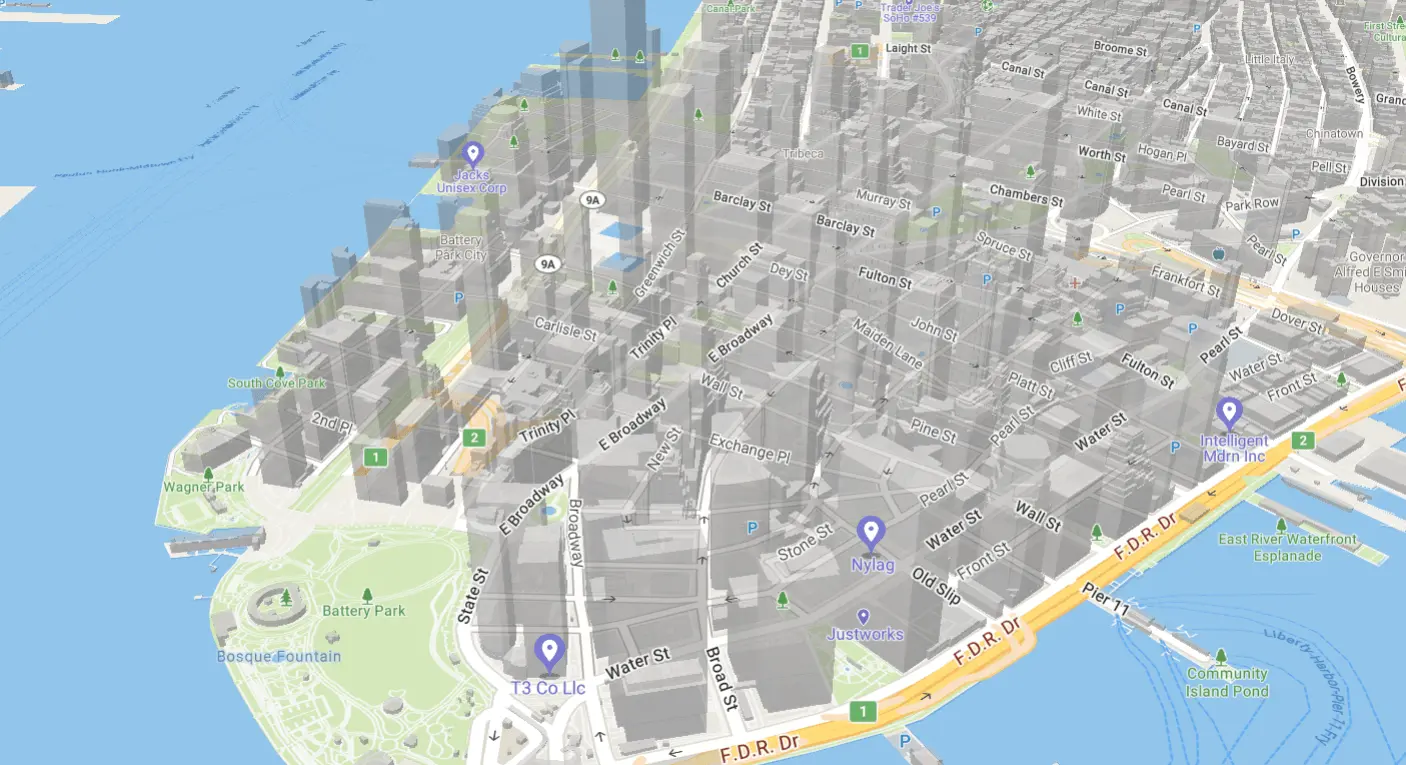
3D Buildings
Displays 3D buildings on the map.
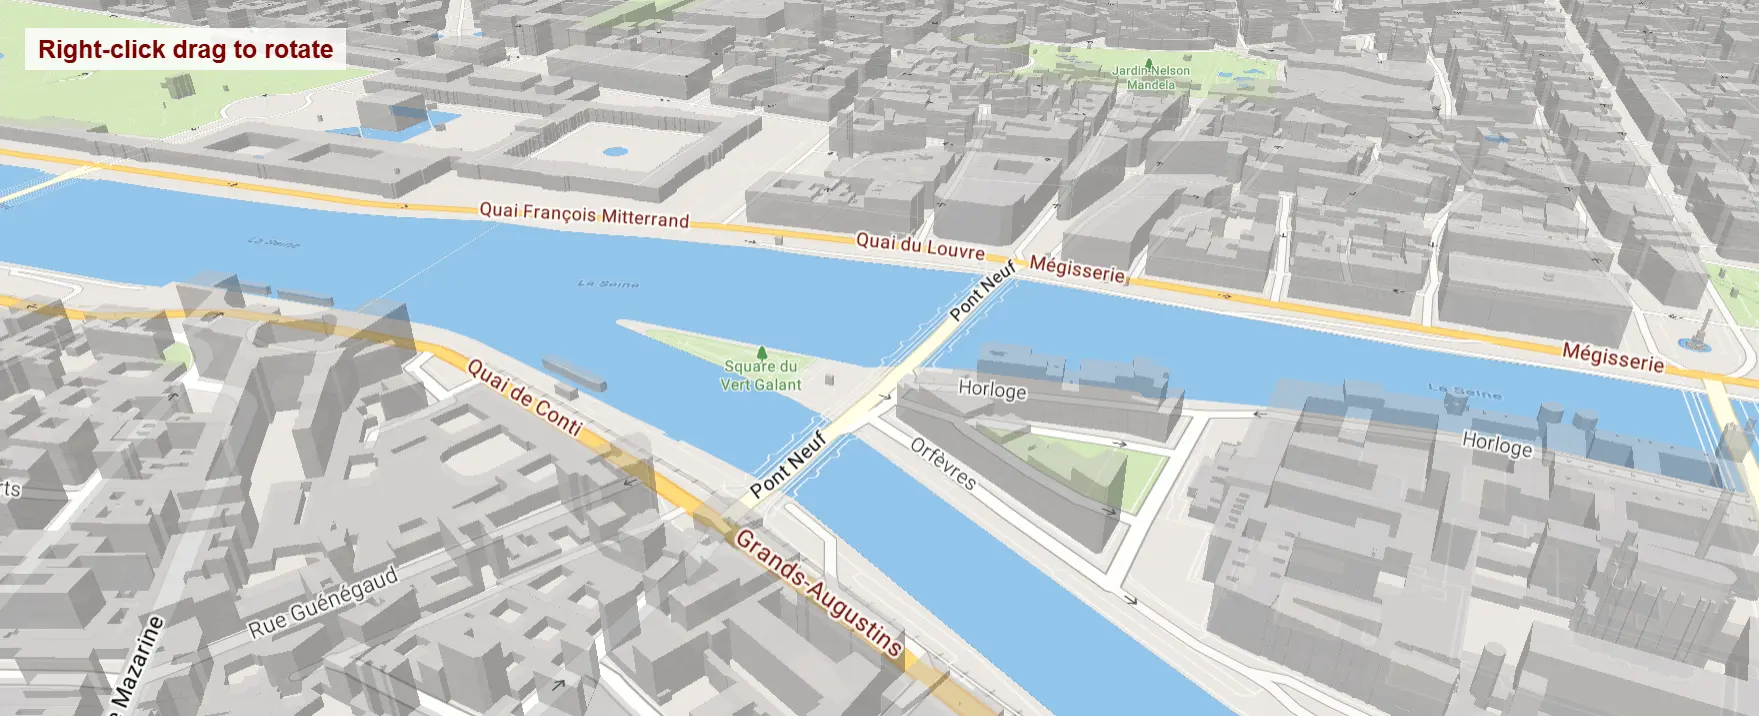
3D Buildings (Europe)
Displays 3D buildings on the map with Europe region maps.
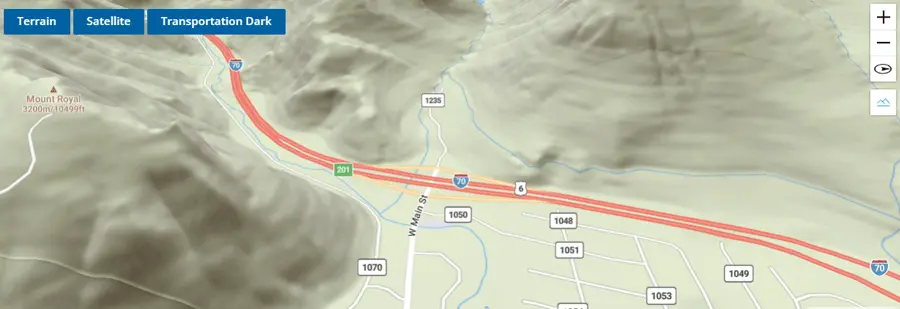
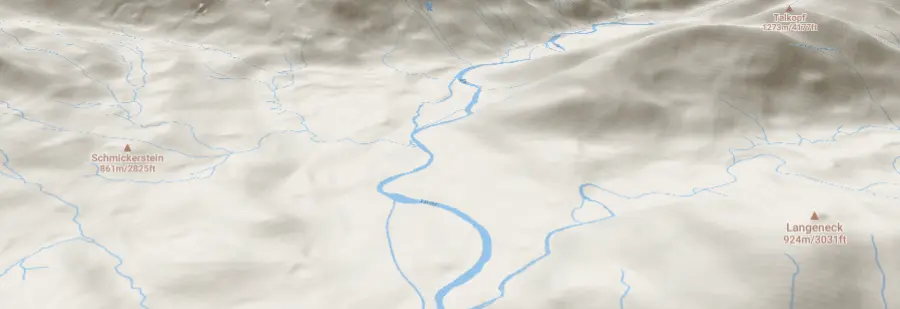
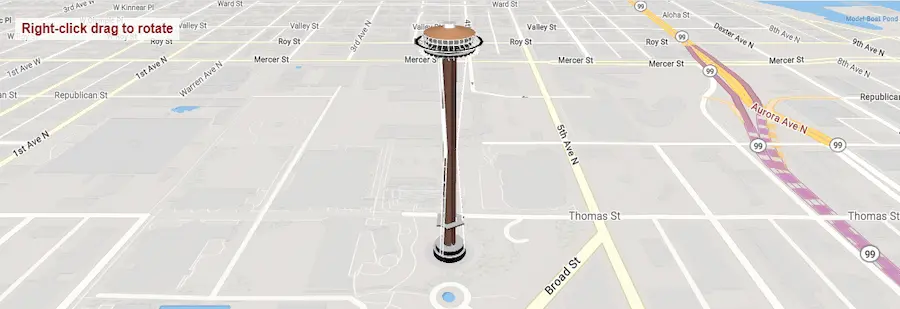
3D Terrain
Use the Terrain Control to enable 3D terrain on the map.
Add 3D Model With Terrain
Use a custom style layer with three.js to add 3D models to a map with 3D terrain.
Add a 3D Model Using Three.js
Show a 3D model on the map using three.js. The model is Trimble-owned content from the SketchUp team.

Add a 3D Model with BabylonJS
Use a custom style layer with babylon.js to add a 3D model to the map.
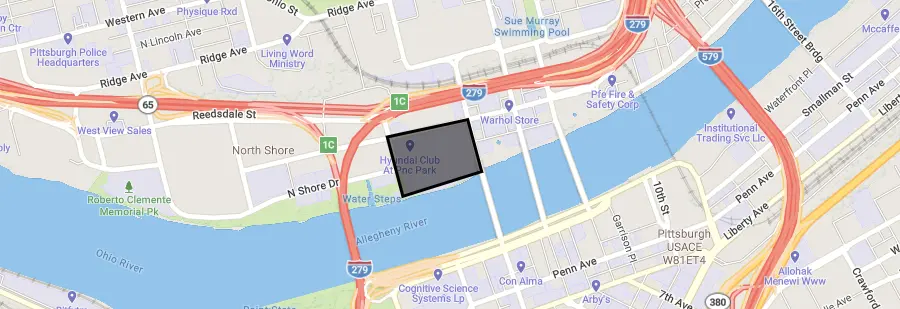
Add a GeoJSON Polygon
Add a polygon to the map using GeoJSON.
Add a raster tile source
Add a third-party raster source to the map.
Add an animated icon to the map
Add an animated icon to the map that was generated at runtime with the Canvas API.
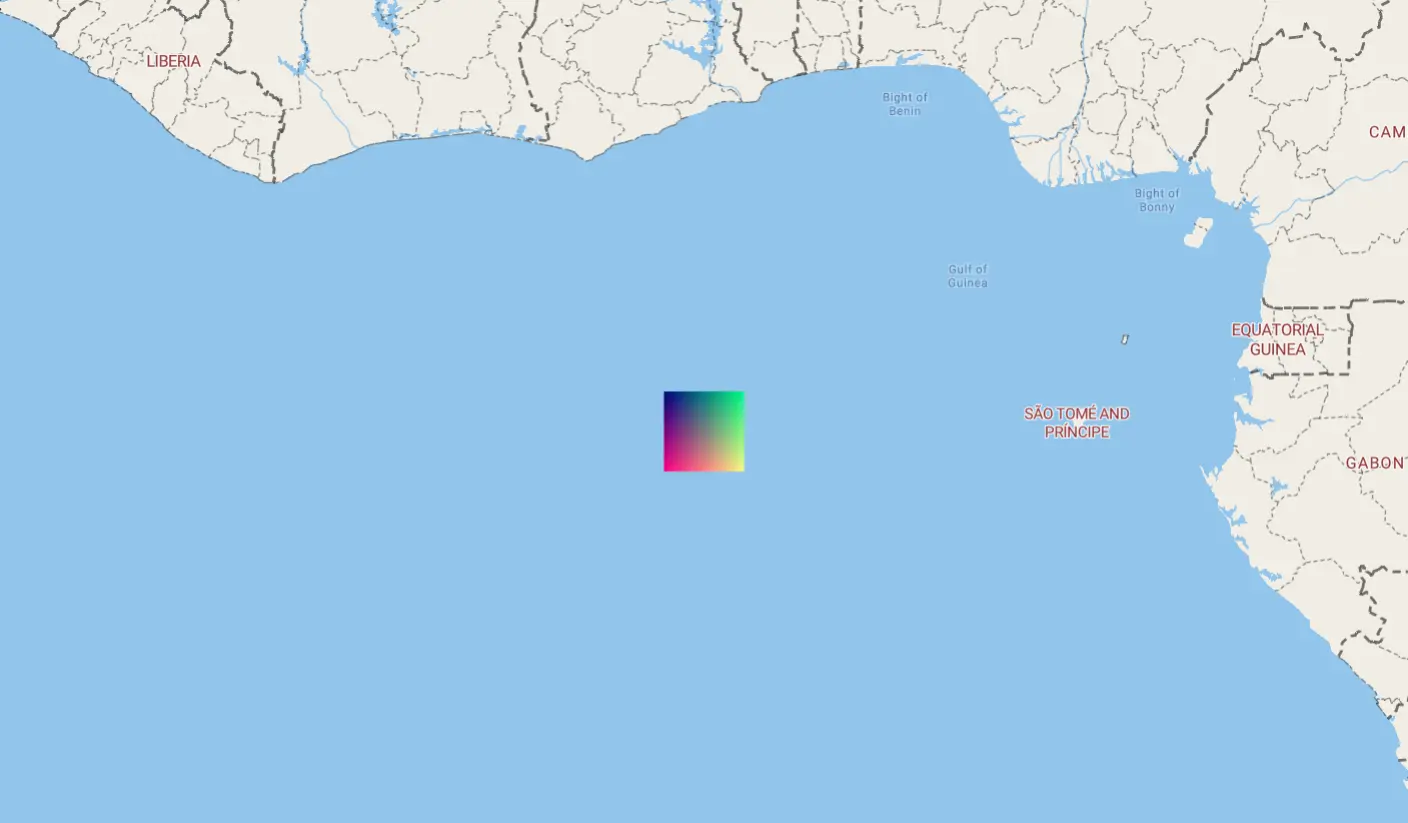
Add Image Generated
Add an icon to the map that was generated at runtime.
Add Image Missing Generated
Dynamically generate a missing icon at runtime and add it to the map.
Animate a Point along a Route
Use Turf to smoothly animate a point along the distance of a line.
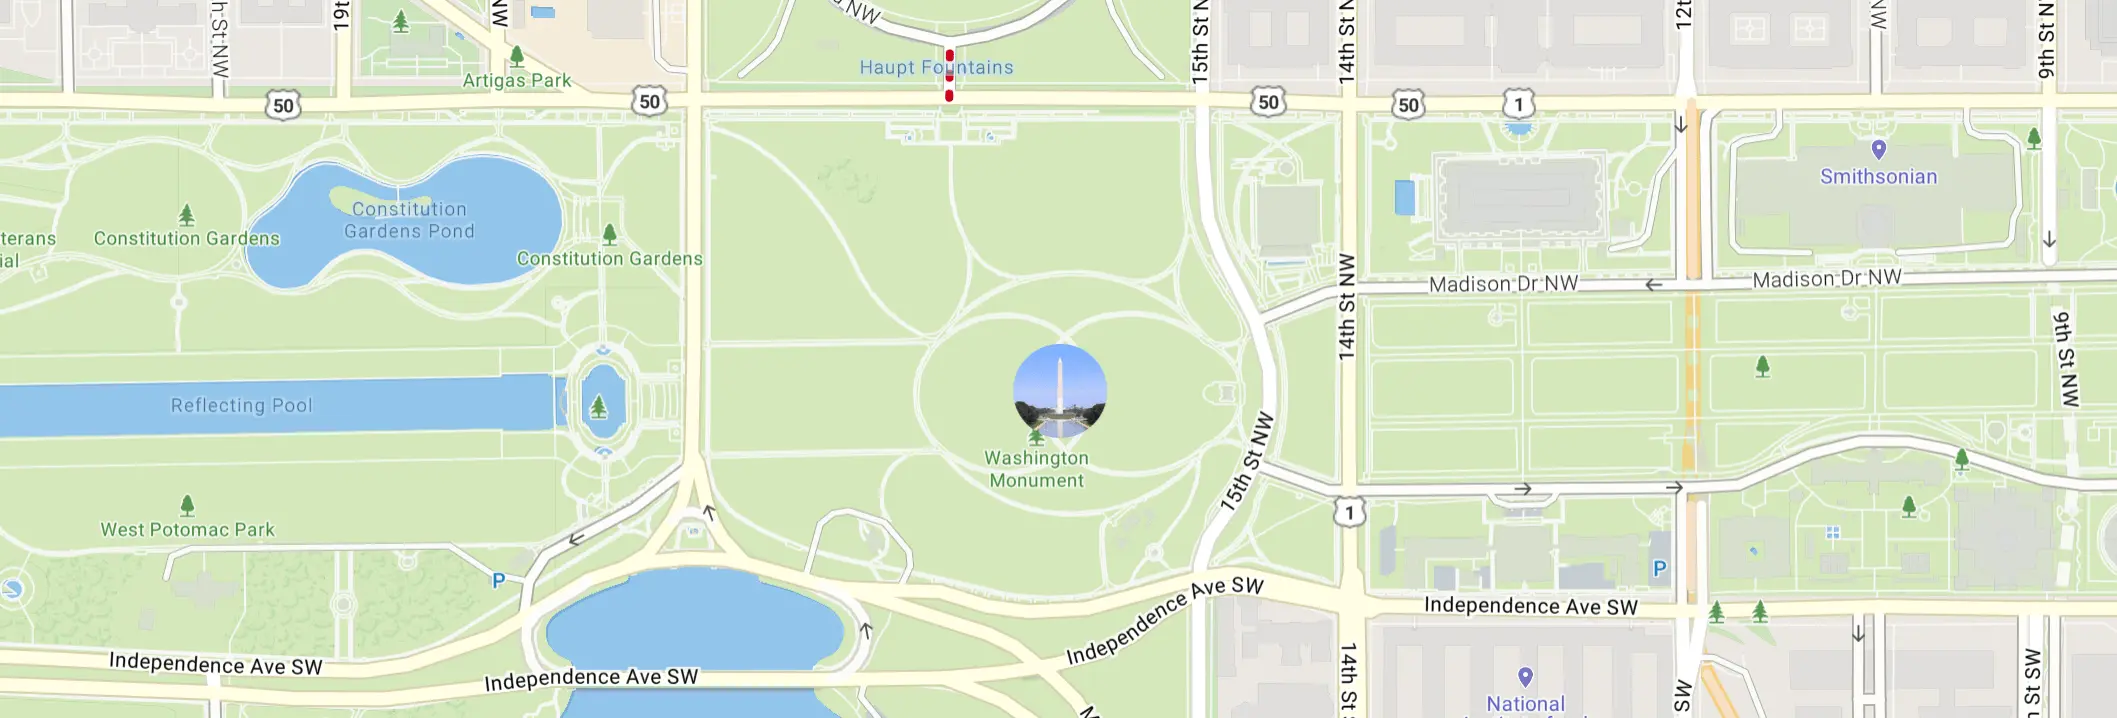
Center on Symbol
Use events and flyTo to center the map on a symbol.
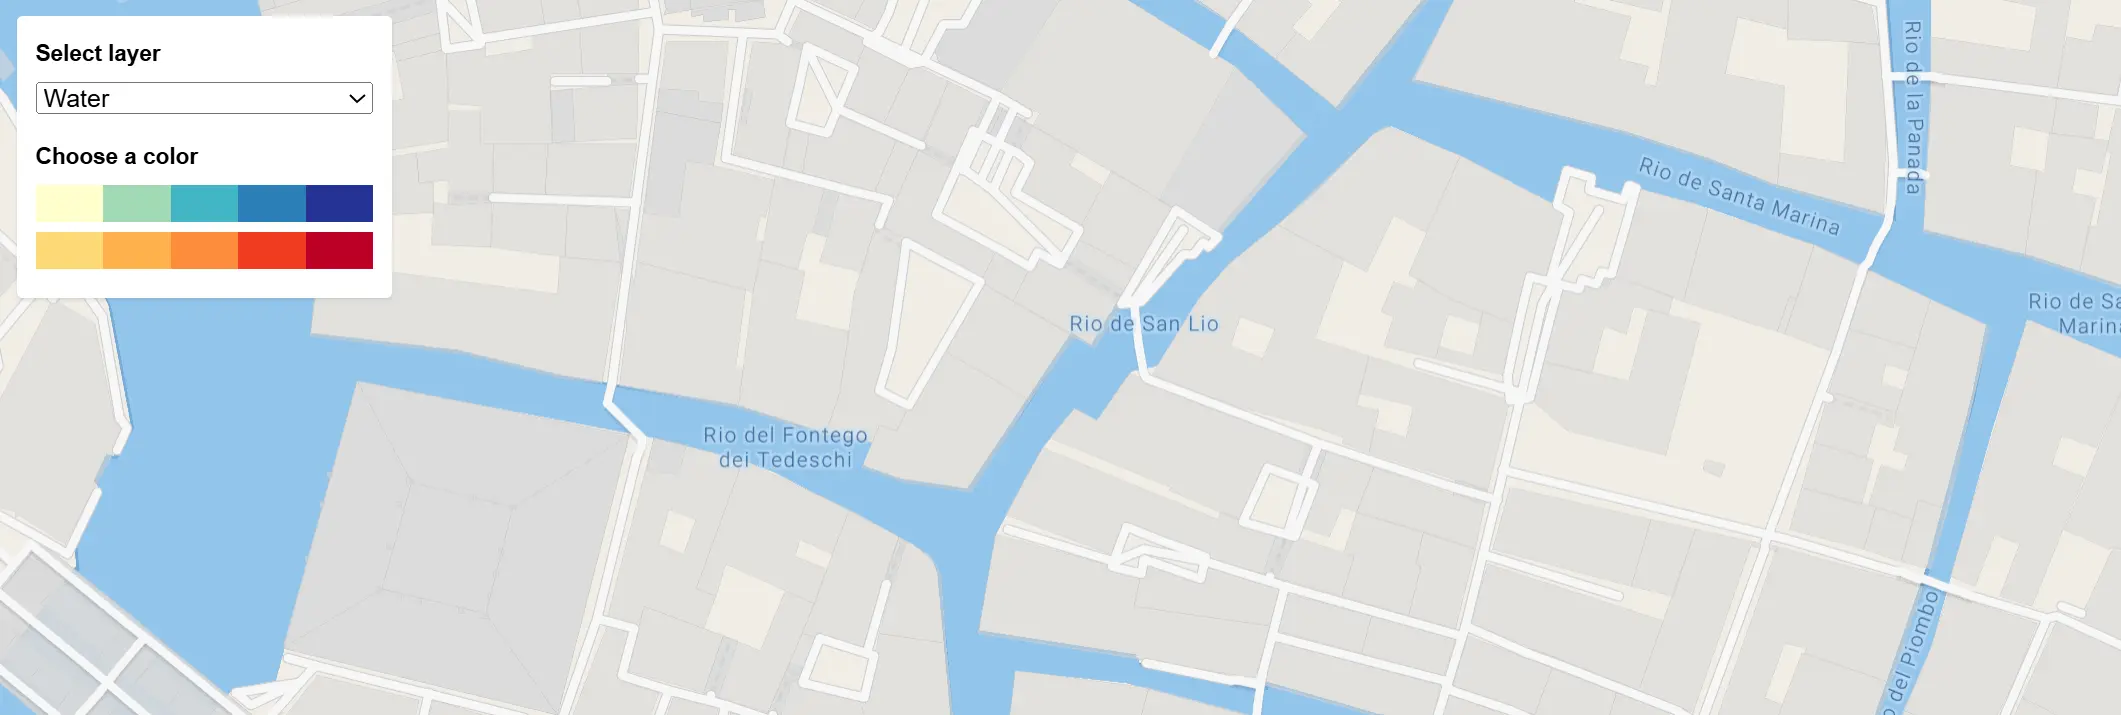
Change a layer's color with buttons
Use setPaintProperty to change a layer’s fill color.
Cluster Points
Configure the map to cluster nearby points and show a count of the clustered points at higher zoom levels.
CO2 Emissions
Calculate the CO₂ emissions for a route. See toll detail CO₂ classes for configuration details.
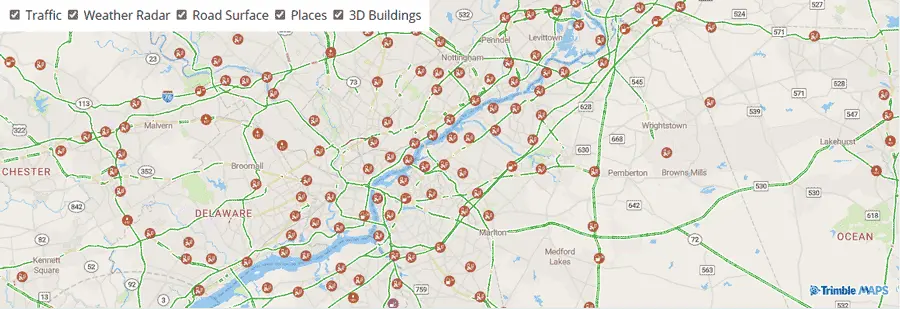
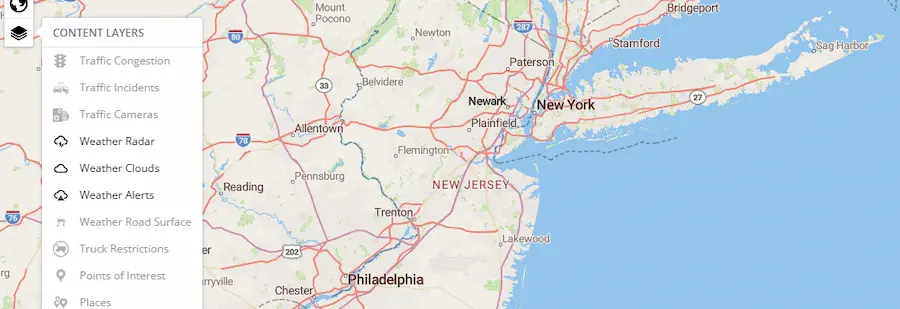
Content Layers
The Trimble Maps JS SDK has several content layers such as traffic, weather, and 3D buildings. The visibility for each layer can be set, retrieved, or toggled.
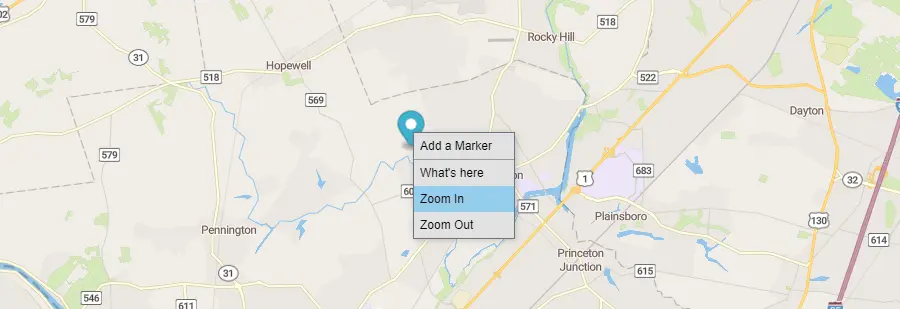
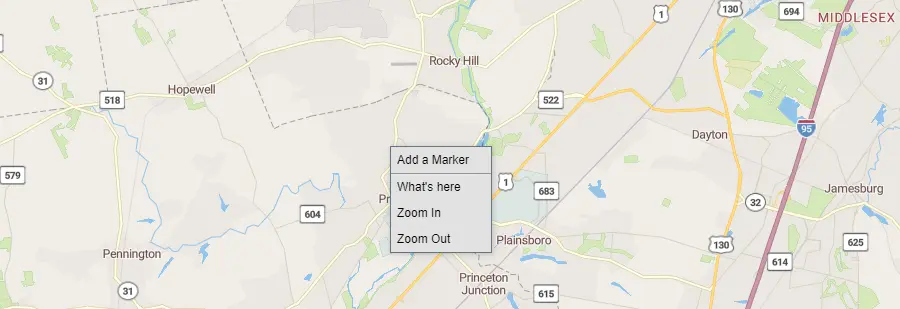
Context Menu
Demonstrates how to create custom context menu by right clicking on the map. The sample code handles a contextmenu event to create / remove a context menu.
Cooperative gestures
Enable cooperative gestures with a specific language. See how it behaves in fullscreen mode.
Create a draggable marker
Drag the marker to a new location on a map and populate its coordinates in a display.
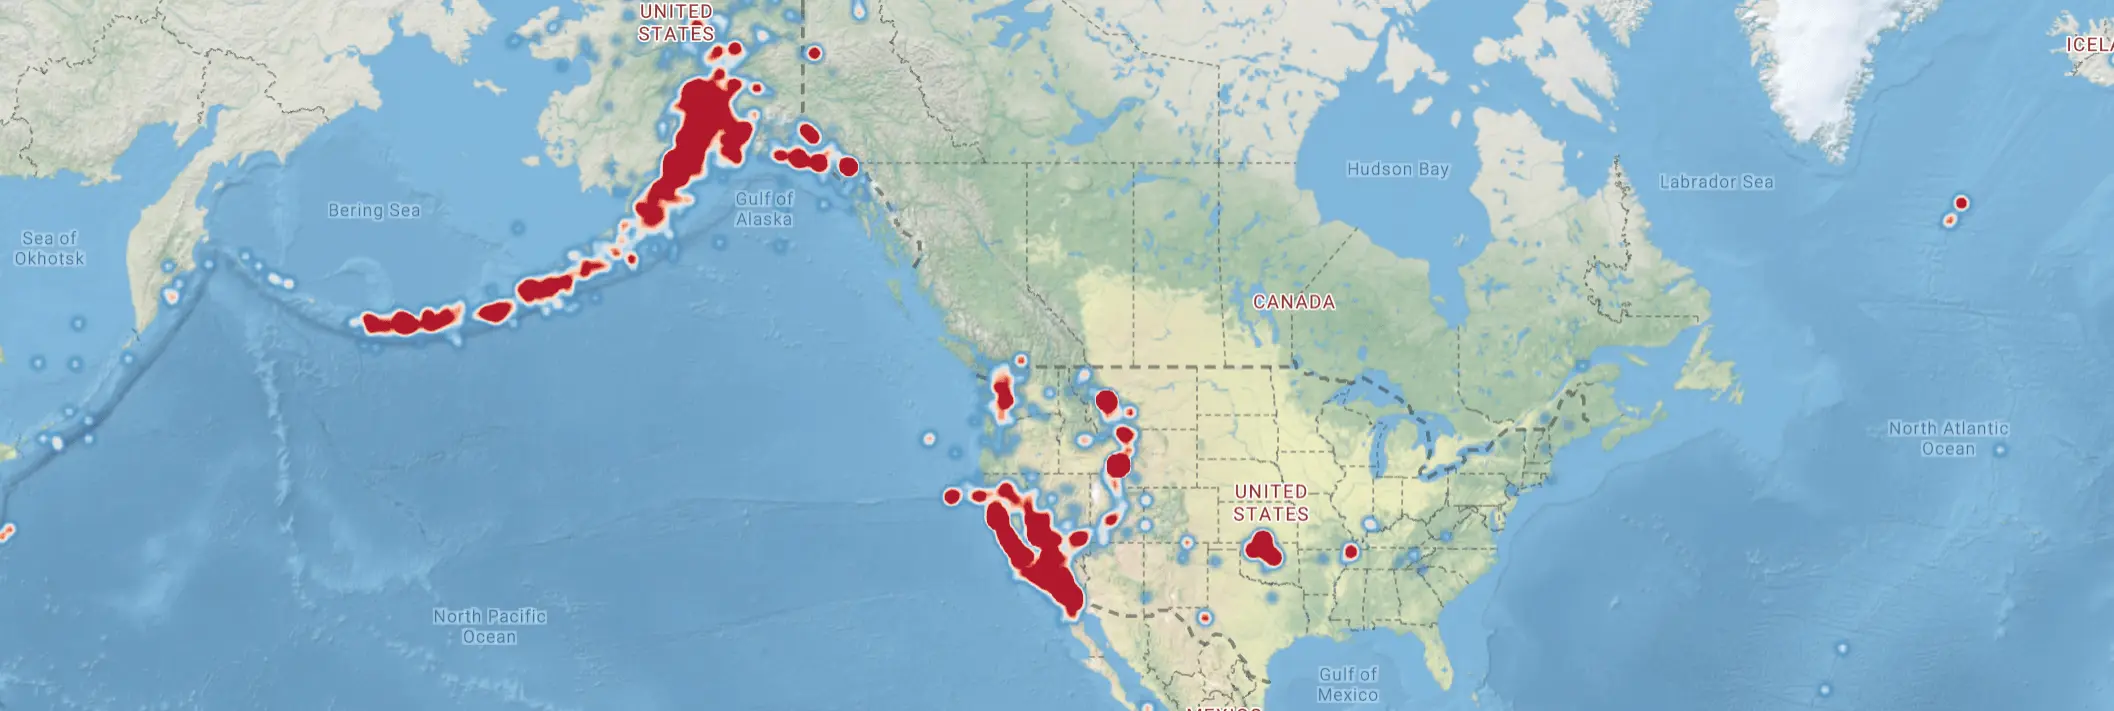
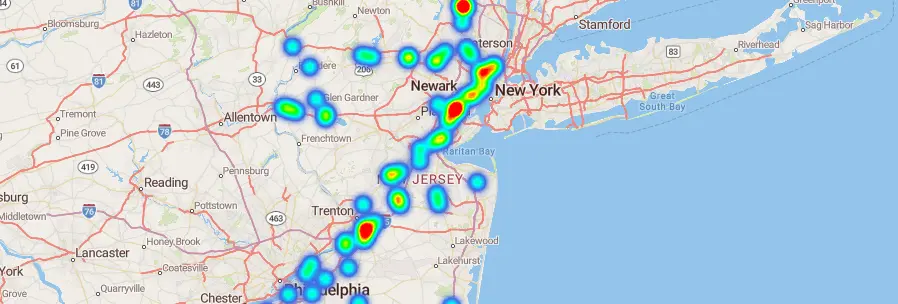
Create a heatmap layer
Visualize earthquake frequency by location using a heatmap layer.
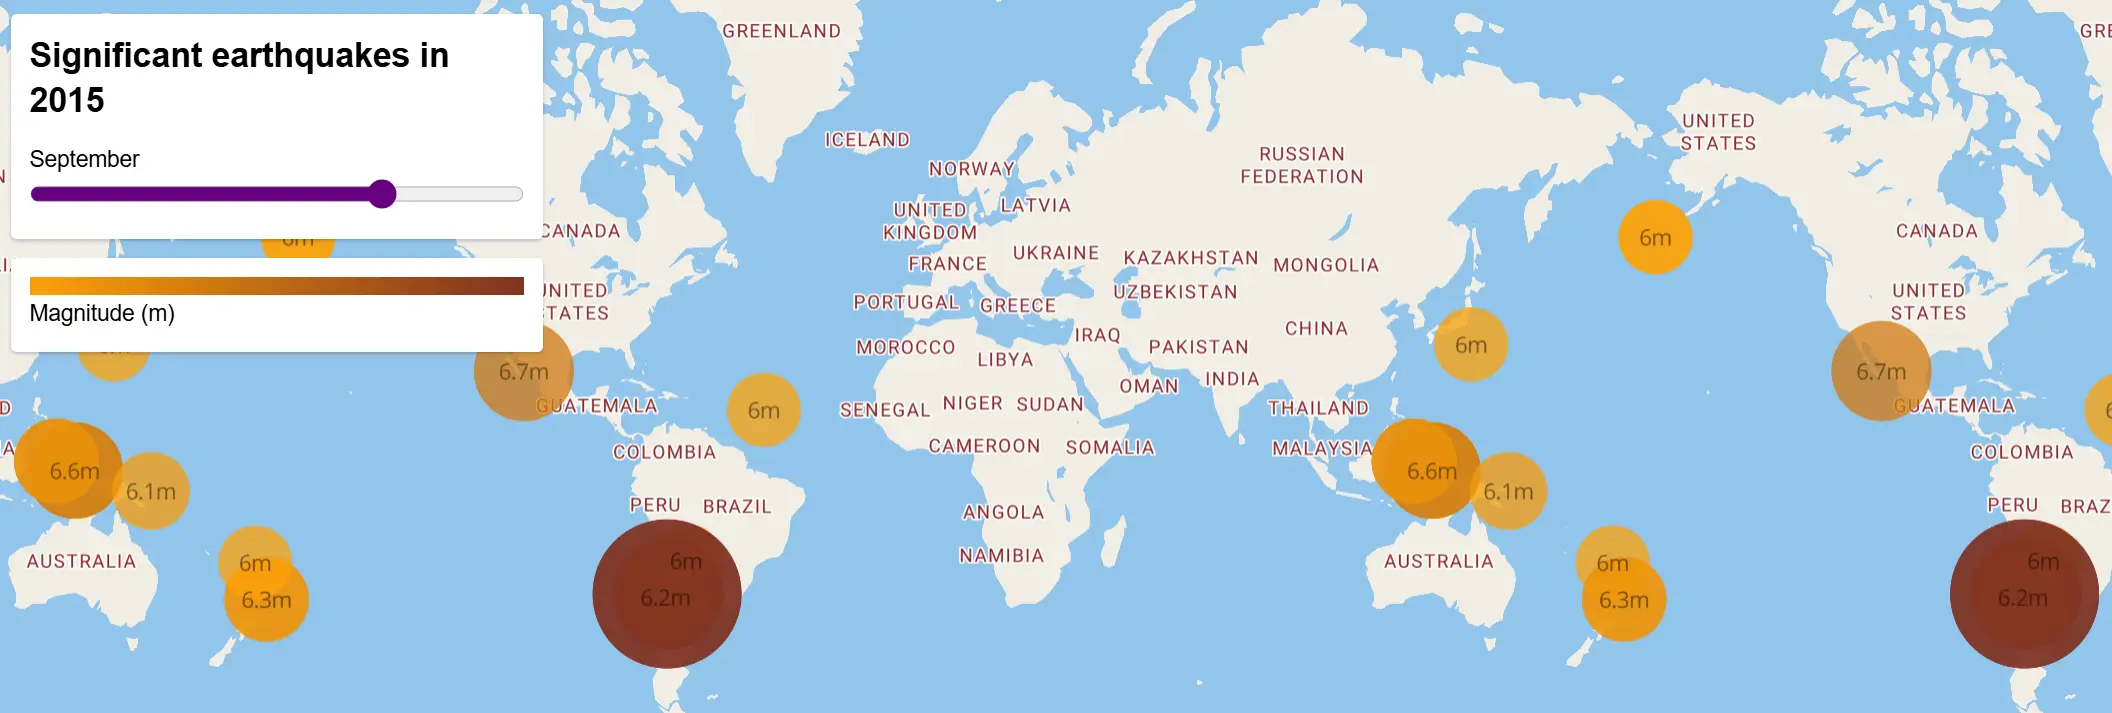
Create a time slider
Visualize earthquakes with a range slider.
Custom HTML Marker
Customize a marker with an icon, label, tooltip, SVG icon or SVG content.
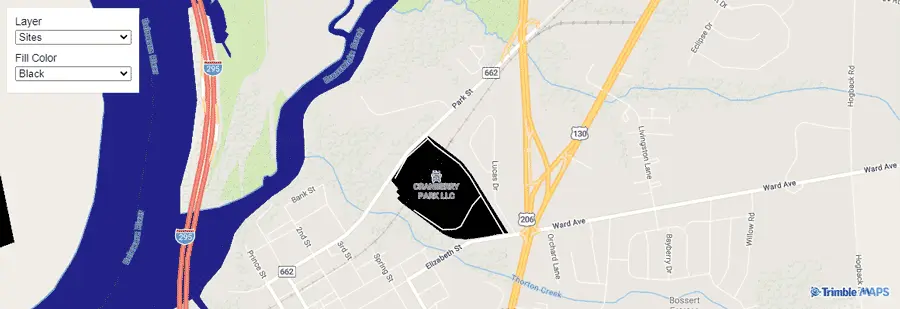
Custom Layers
Add your own layers to display custom data.
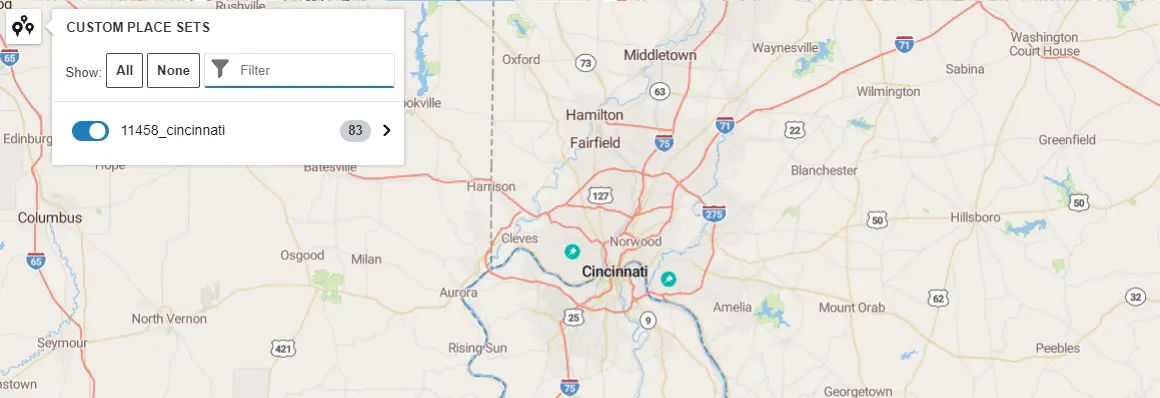
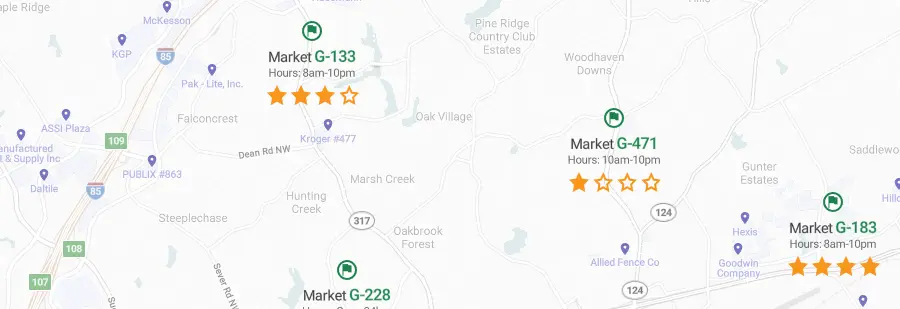
Custom Places
Add your own places to a map.
Customize Popup
This application shows how to intercept the place details popup and add custom application components to it. To , zoom in on a place, click its icon, and scroll down to the bottom of the popup.
Dark Mode UI
Initialize a map with dark mode map controls (buttons and menus) by adding the trimblemaps-dark class to the map. To change the map style check the Maps Styles.
Data Driven Styles
Change styling based on data source values.
Data Visualization Icons
Trimble Maps provides a set of data visualization icons for use on your maps. You can see a list of these icons here.
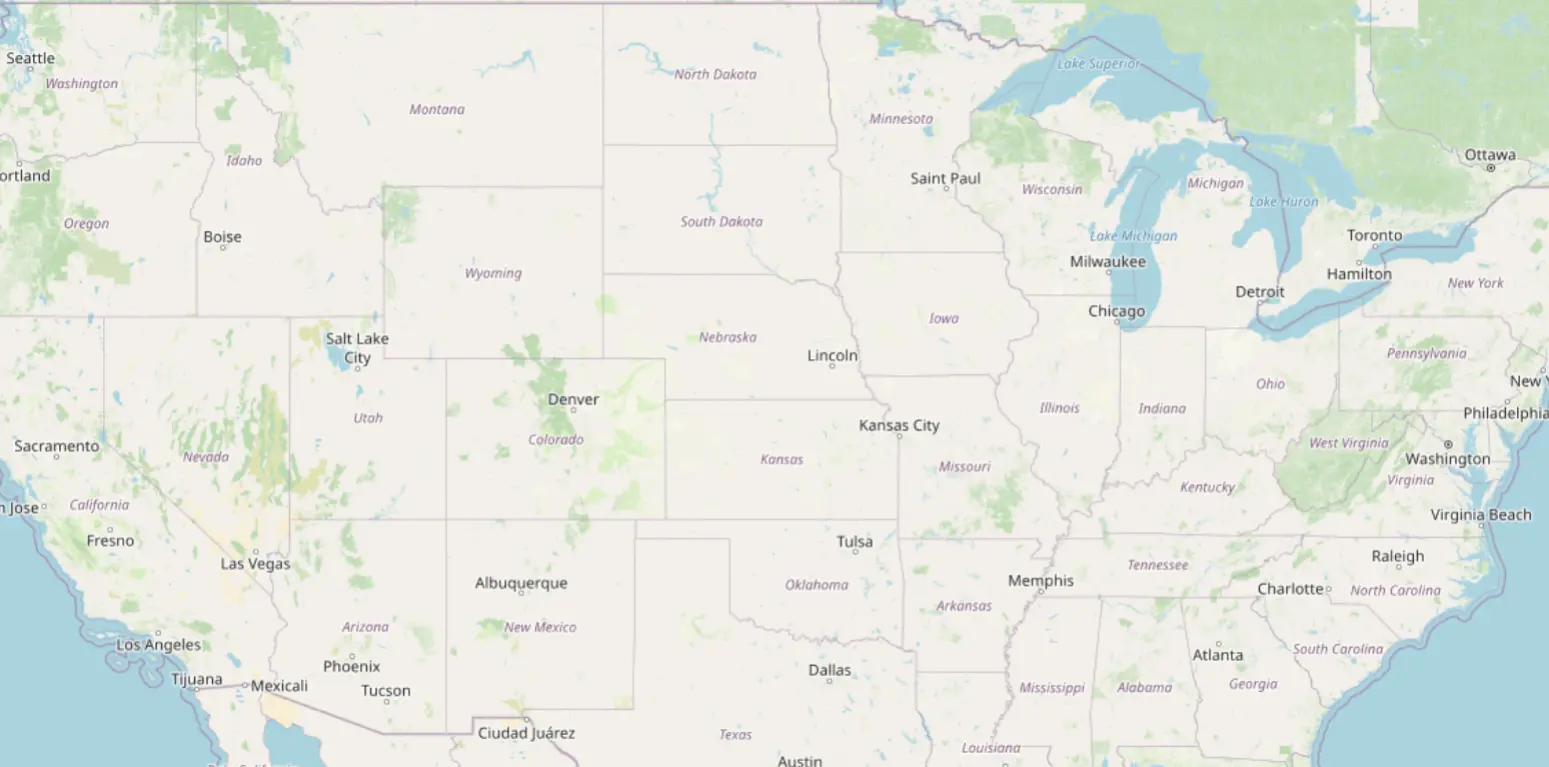
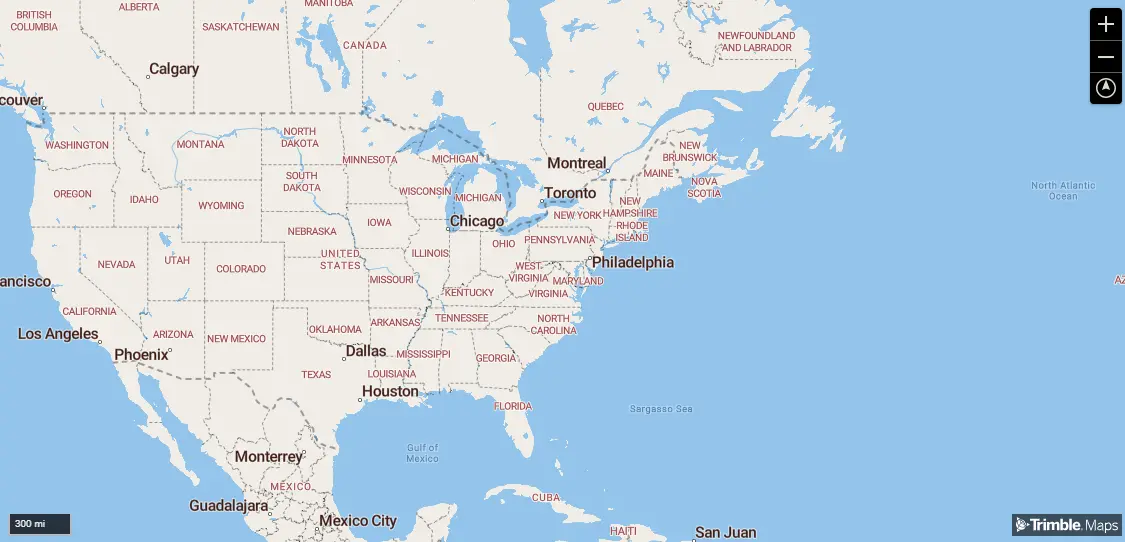
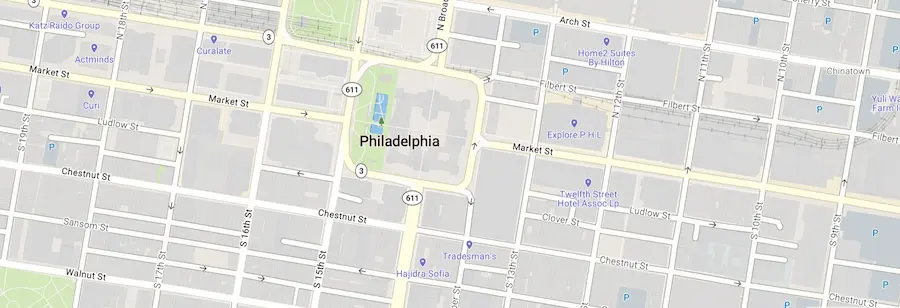
Display a Map
Initialize a map in an HTML element with the Trimble Maps JavaScript SDK.
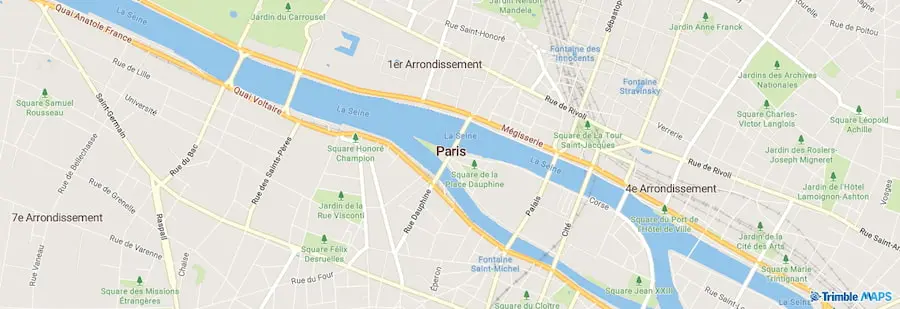
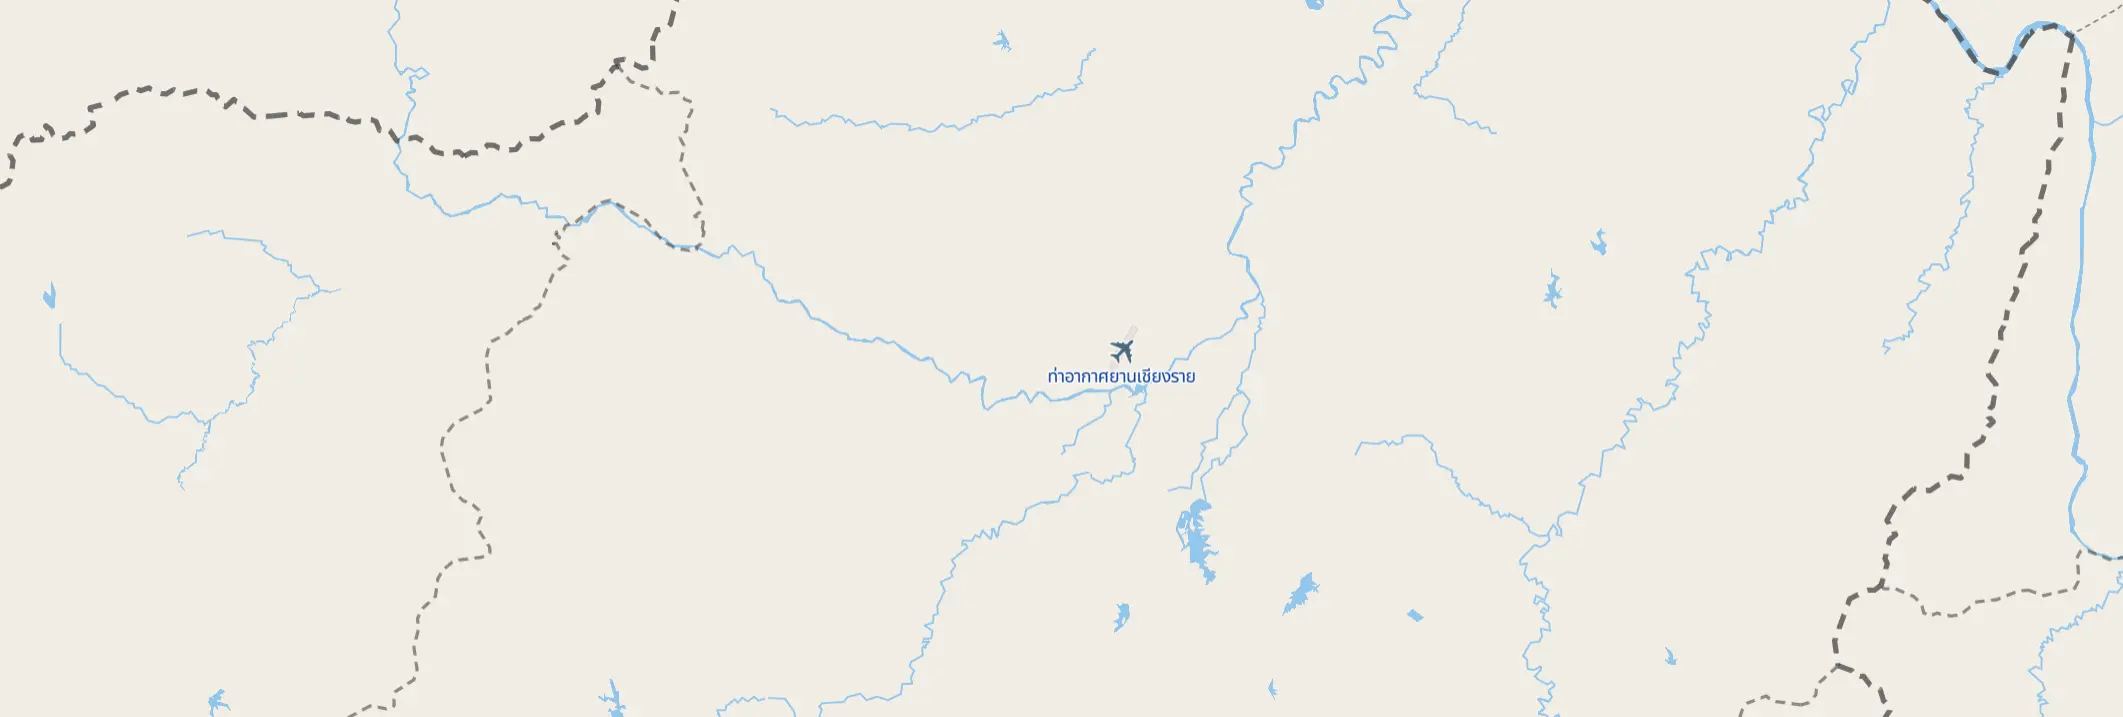
Display a Map (Europe)
Initialize a European map in an HTML element with the Trimble Maps JavaScript SDK. The Region parameter is optional.

Display a Popup on Click
Add a popup to the map that opens when a symbol is clicked.
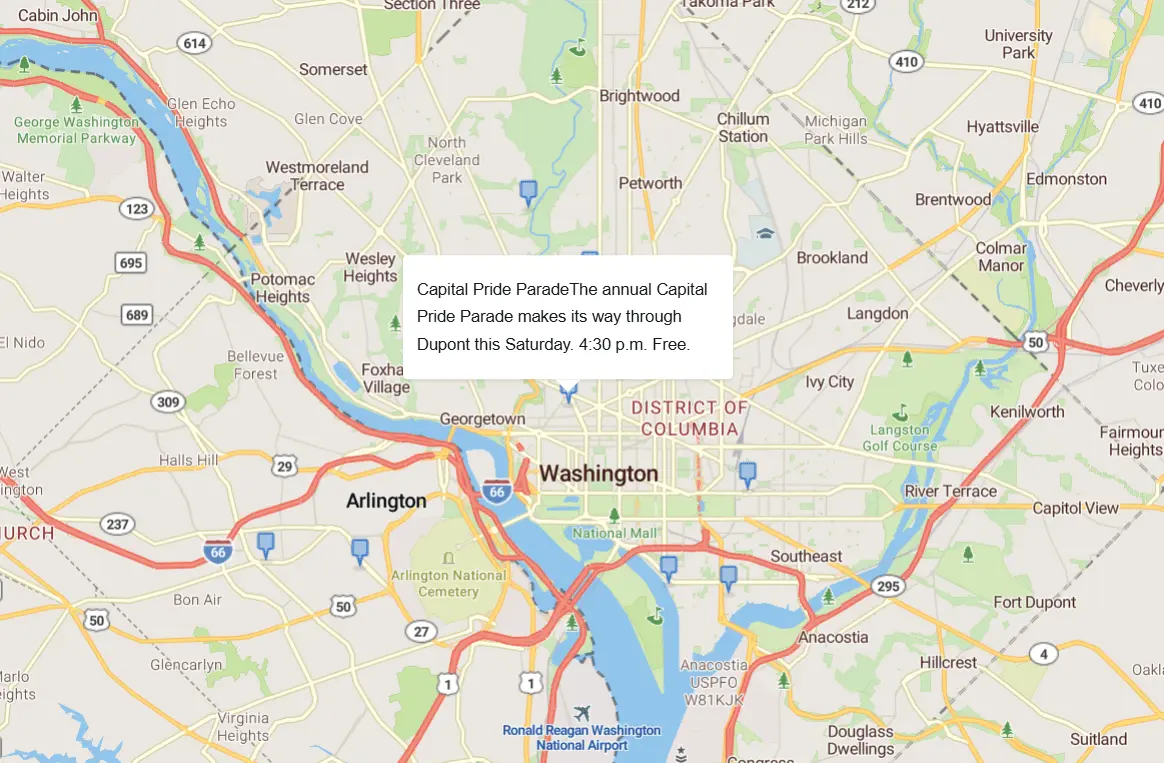
Display a Popup on Hover
Add a popup to the map that opens when a symbol is hovered over.
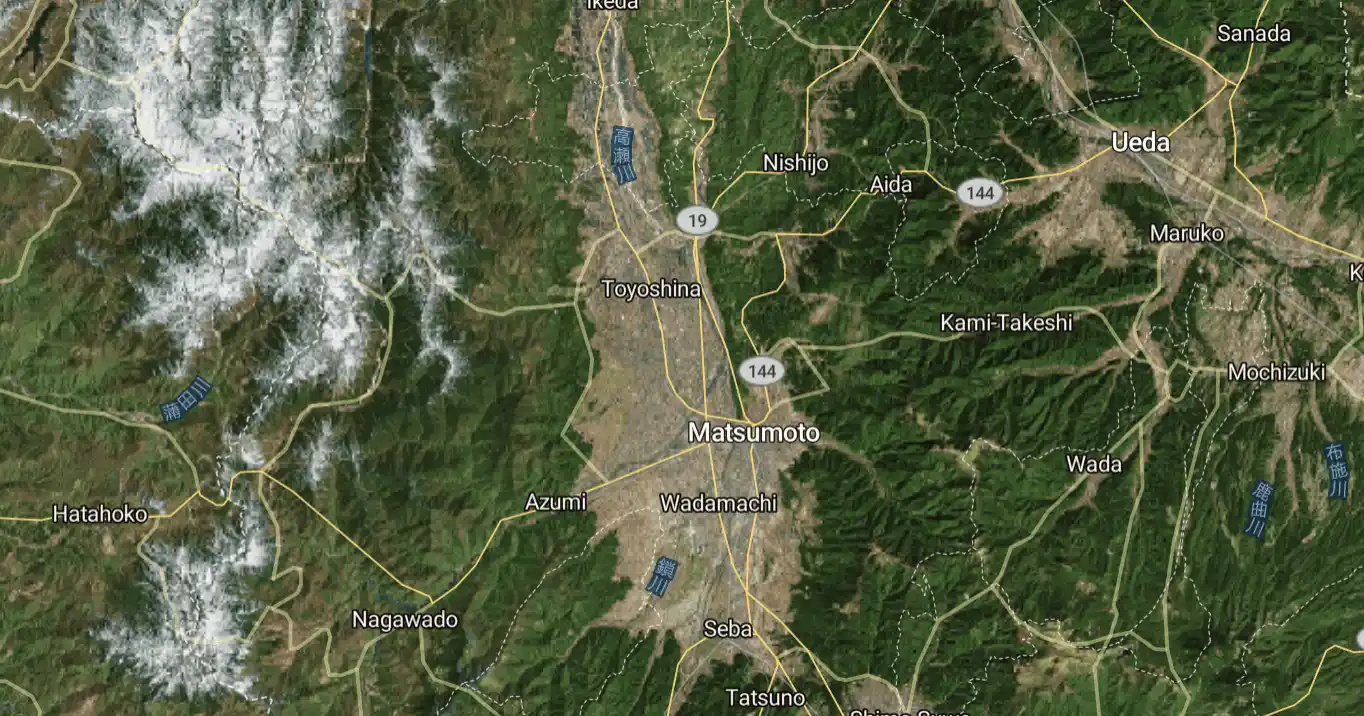
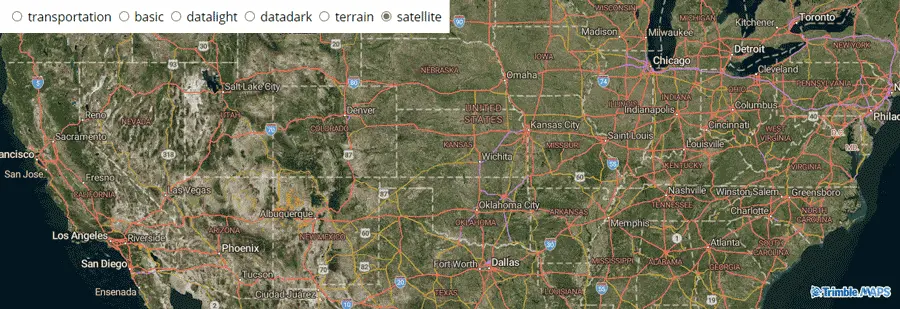
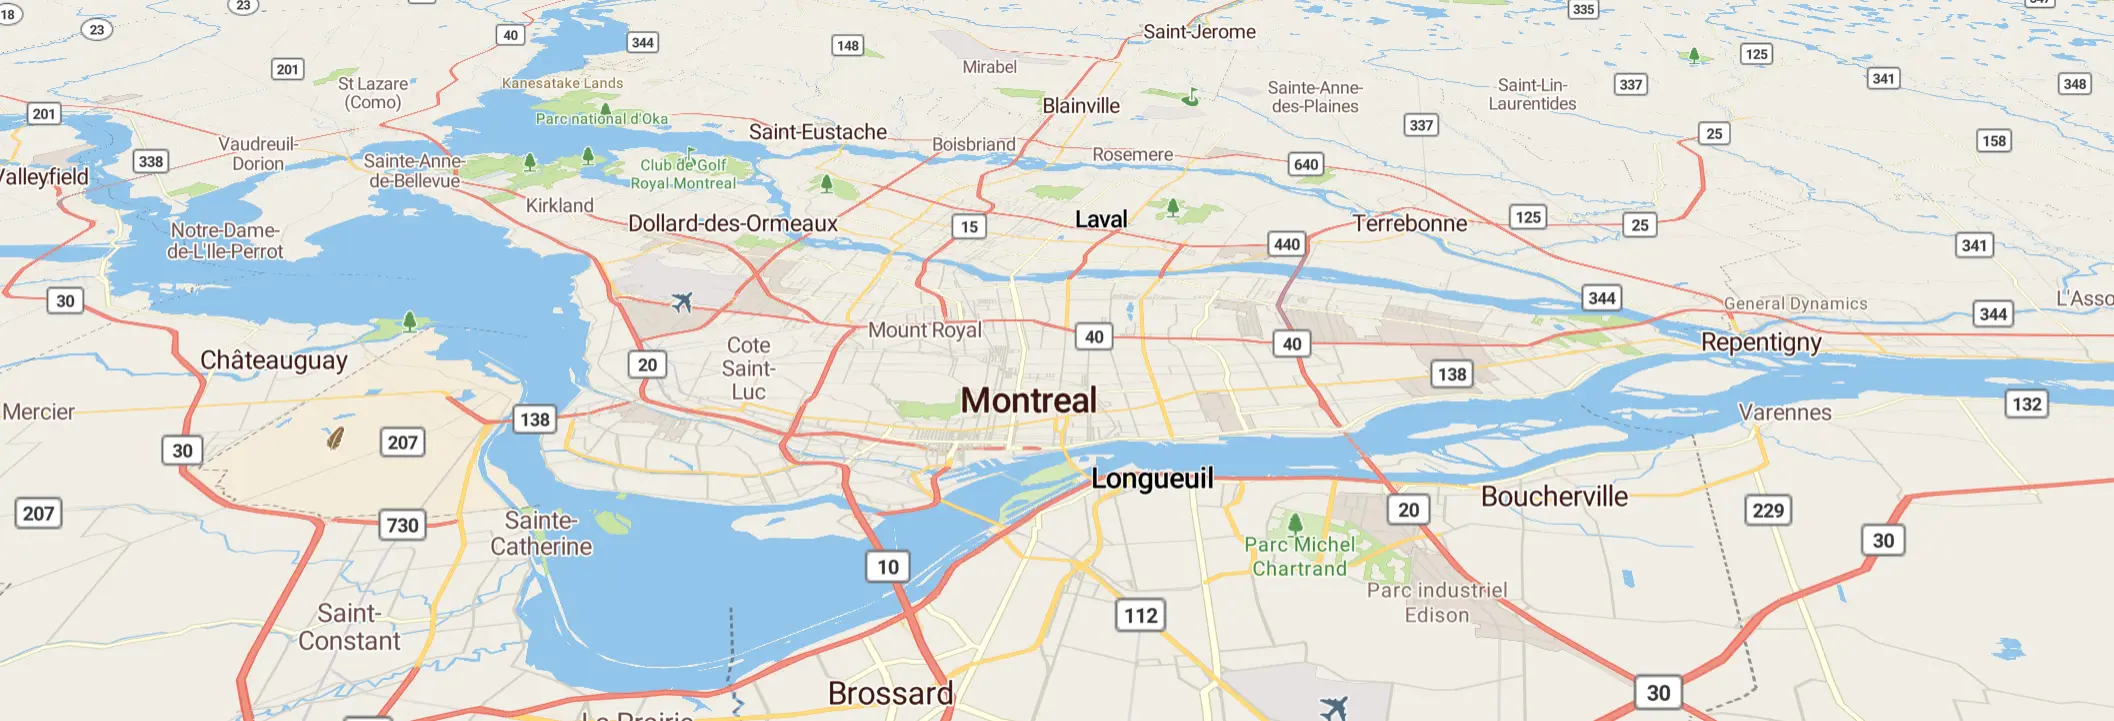
Display a satellite map
Display a satellite raster baselayer
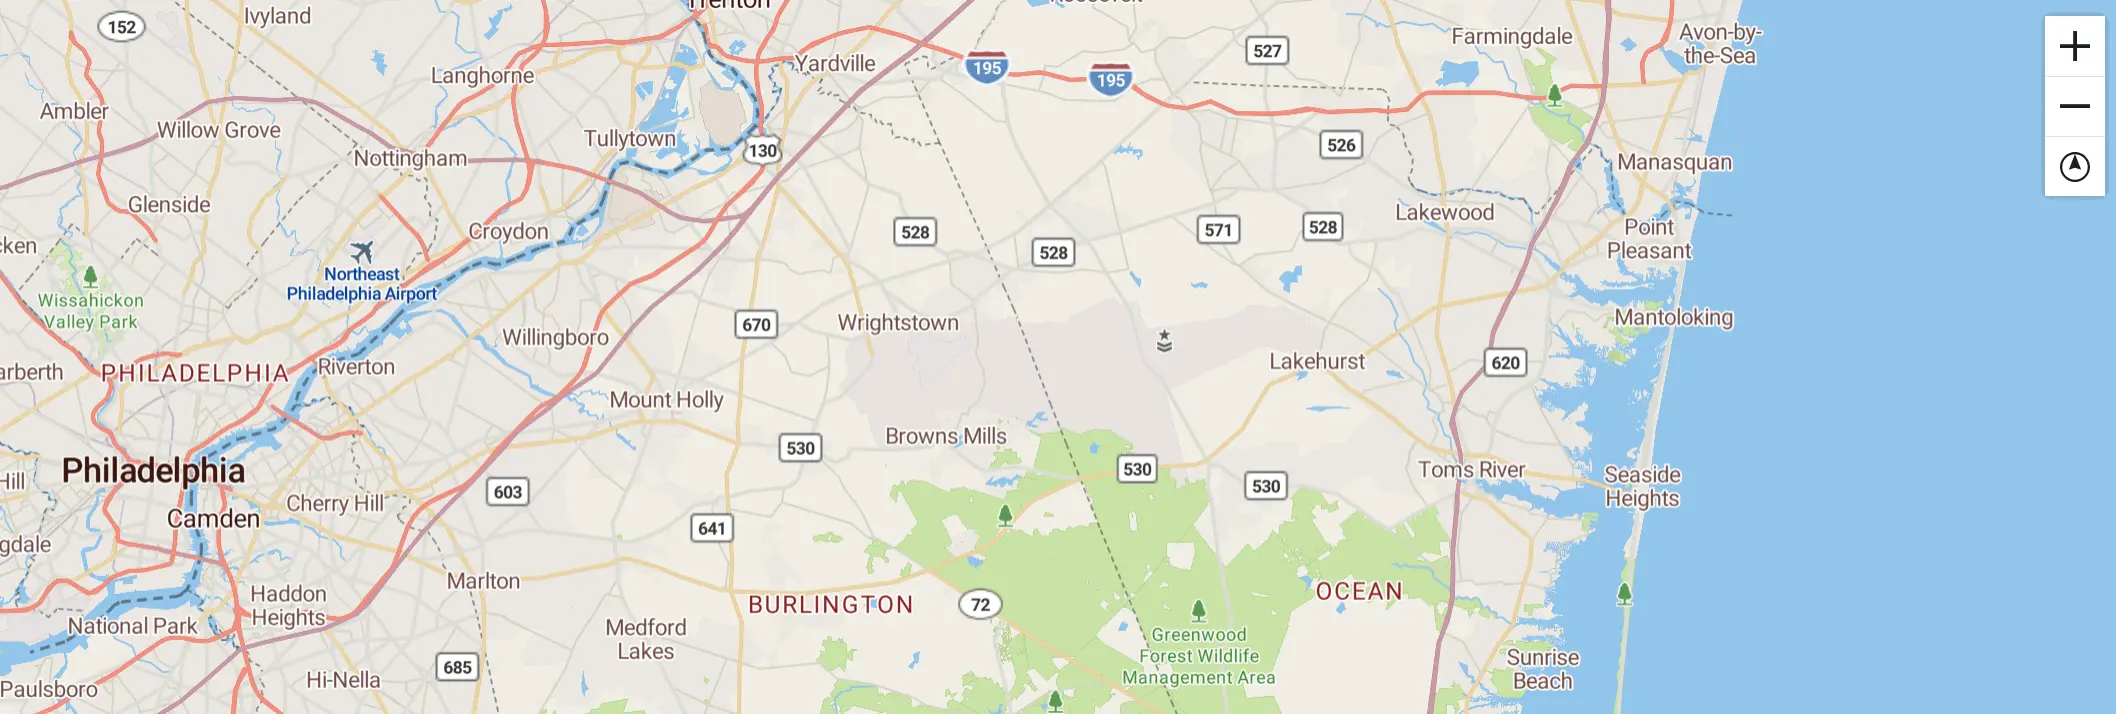
Display map navigation controls
Add zoom and rotation controls to the map.
Draggable Marker Popup
Add a draggable marker to the map.
Draw GeoJSON points
Draw points from a GeoJSON collection to a map.
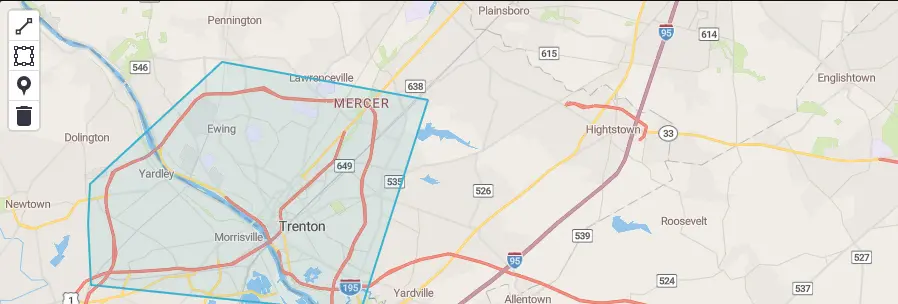
Draw Tool Add-on
An add-on that allows a user to draw markers and polygons on a map. Select a tool from the control bar at the top left corner of the map.
Energy Layers
Include the Energy Layers add-on and associated control in a map.
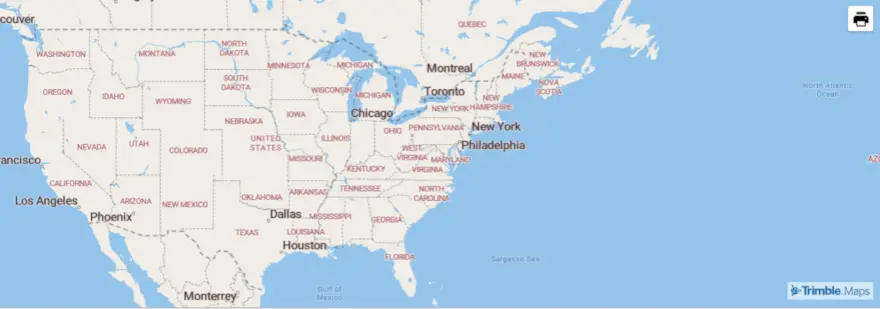
Export Map Addon
The Export Map addon allows is used to print a copy of the map.
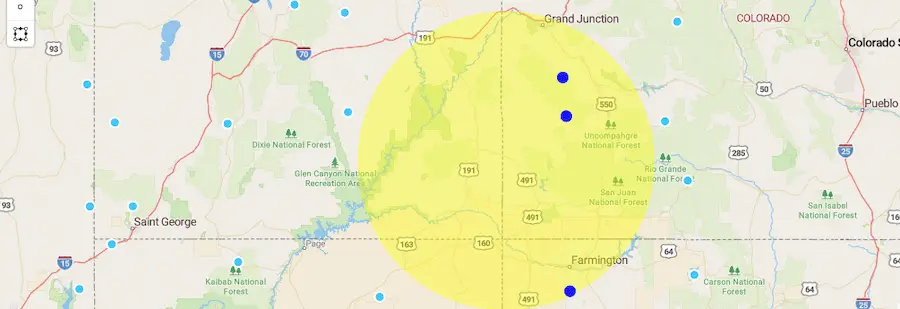
Feature Intersections
This displays a map with 25 bounded random points, and one large circle polygon. Any points that intersect with the circle are colored blue, otherwise active features default to pink and inactive features default to light blue.
Features Under Mouse Pointer
Get the features under a mouse pointer.
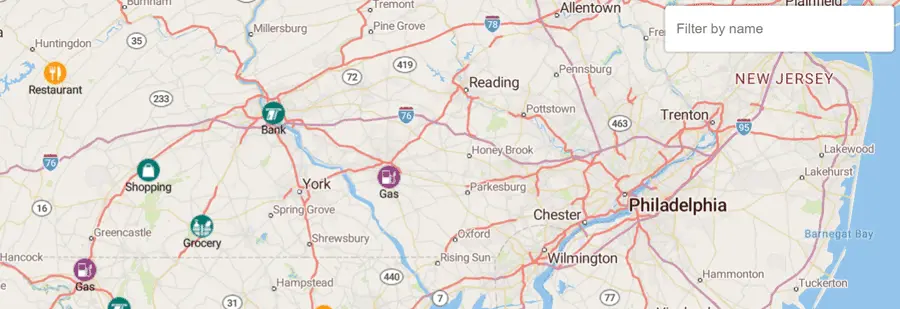
Filter Symbols by Text input
Filter symbols and their associated name by text input.
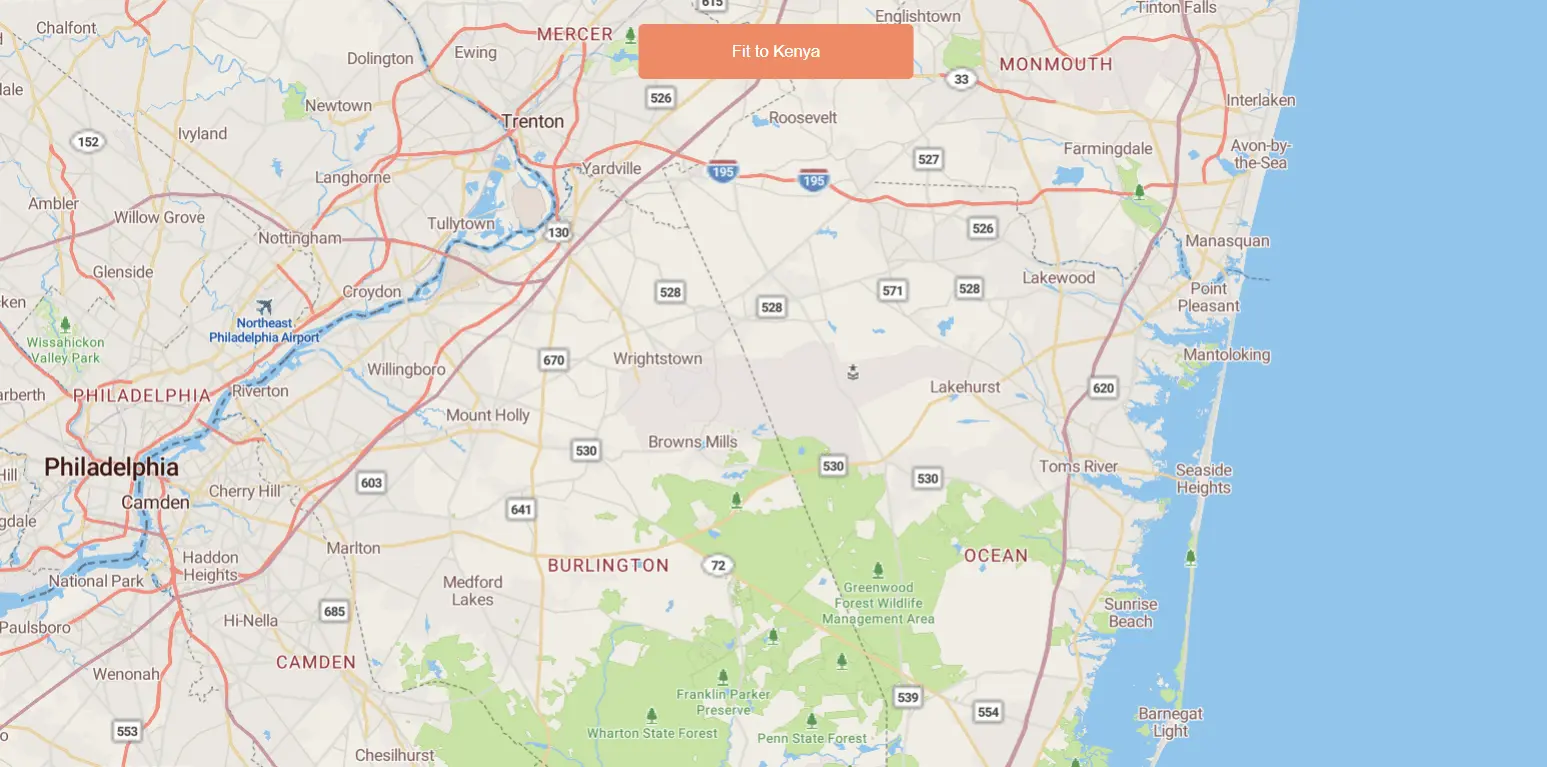
Fit a map to a bounding box
Fit the map to a specific area, regardless of the pixel size of the map.
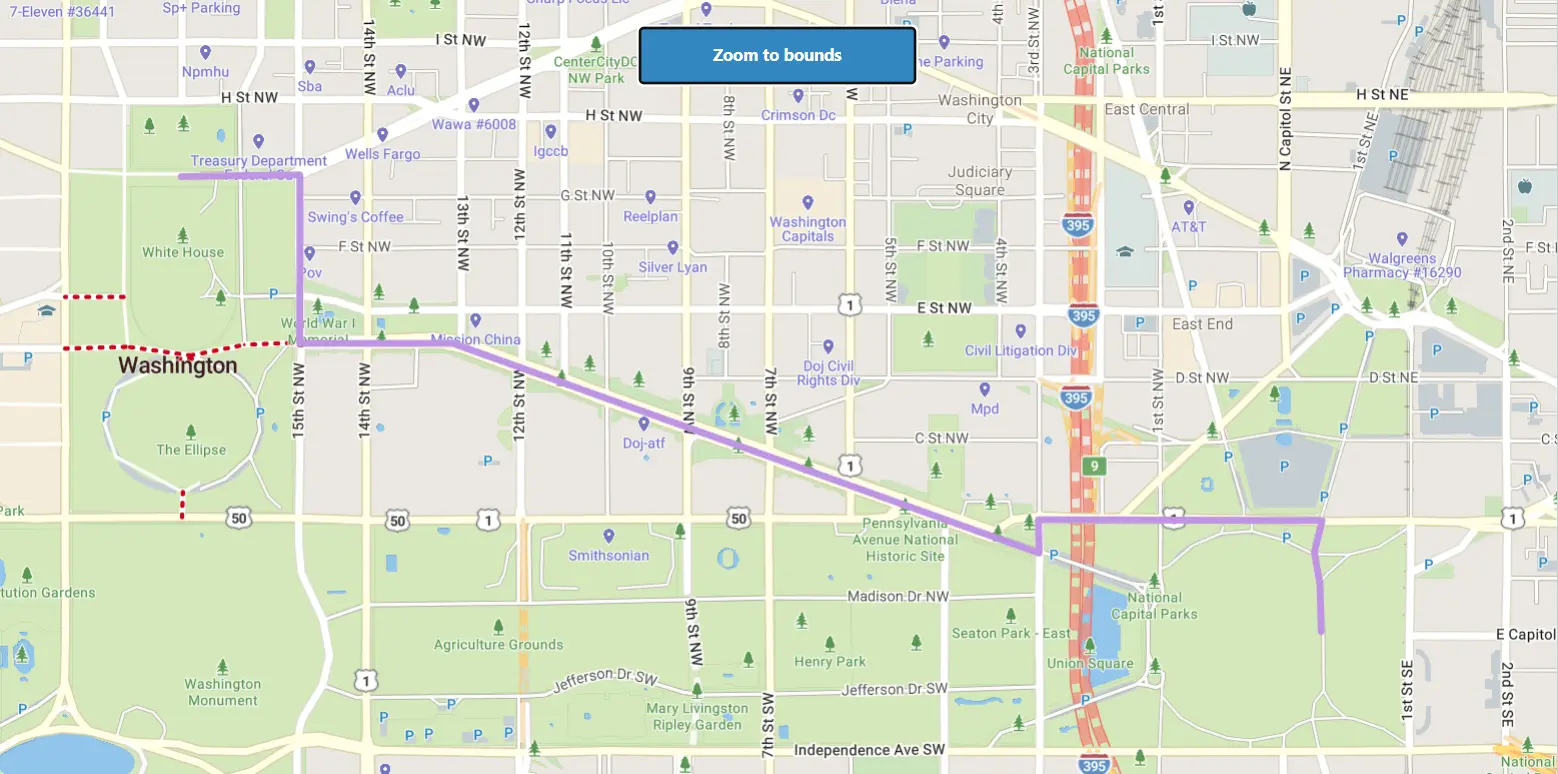
Fit to the bounds of a LineString
Get the bounds of a LineString.
GeoJSON Point
Add a point to the map using GeoJSON.
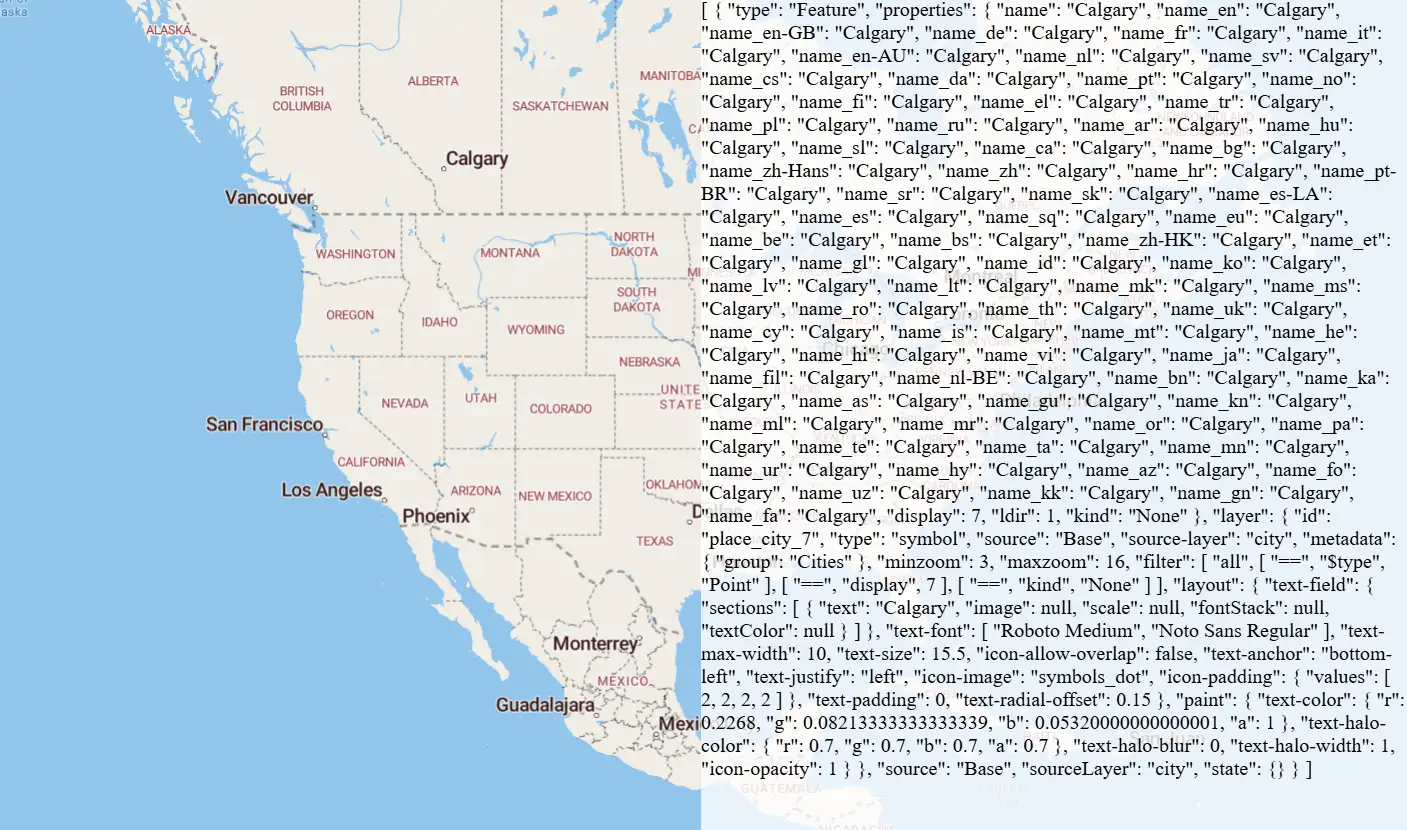
Get features under the mouse pointer
Use queryRenderedFeatures to show properties of hovered-over map elements.
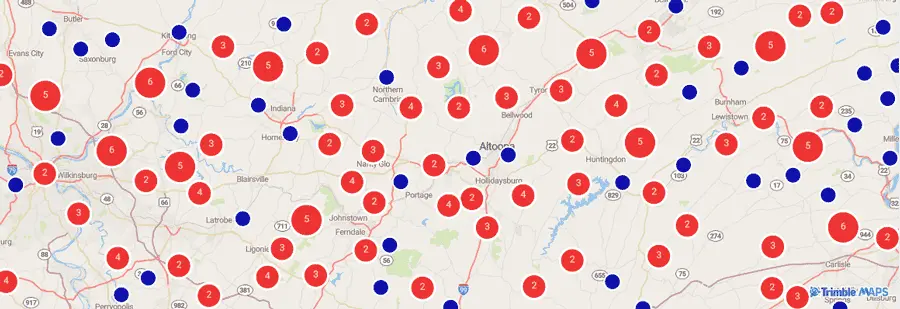
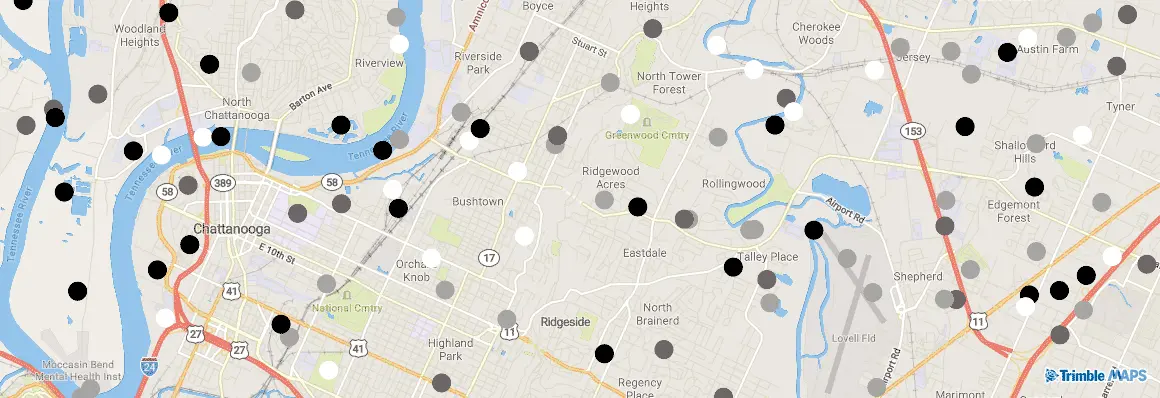
Heat Map
Visualize data with a Heat Map. For simplicity, this relies on data built in a separate script (truck-stops.js).
Hide and Show Markers
Hide or show markers at given zoom levels.
Highlight Selected Features
Select Places to highlight by holding Shift and dragging a selection box over them.
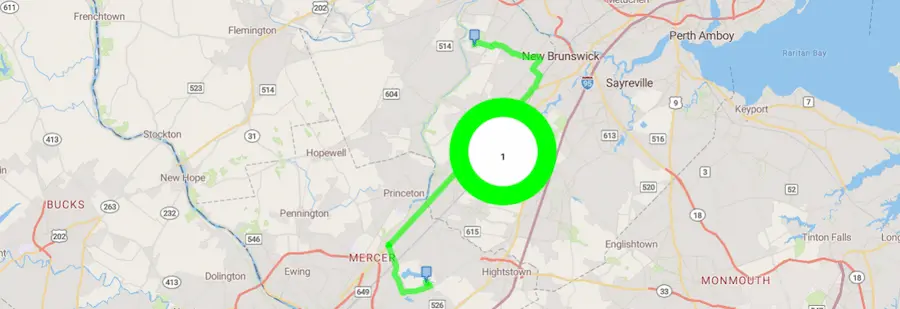
Interactive Routes
By default, routes are static. If you would like to your users to interact with the routes by moving the location of stop or dragging the routes, you just need to set the isDraggable property of the routing layer in the constructor to true.
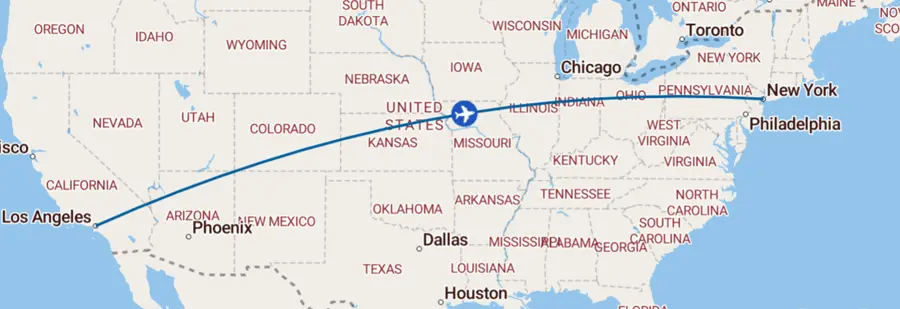
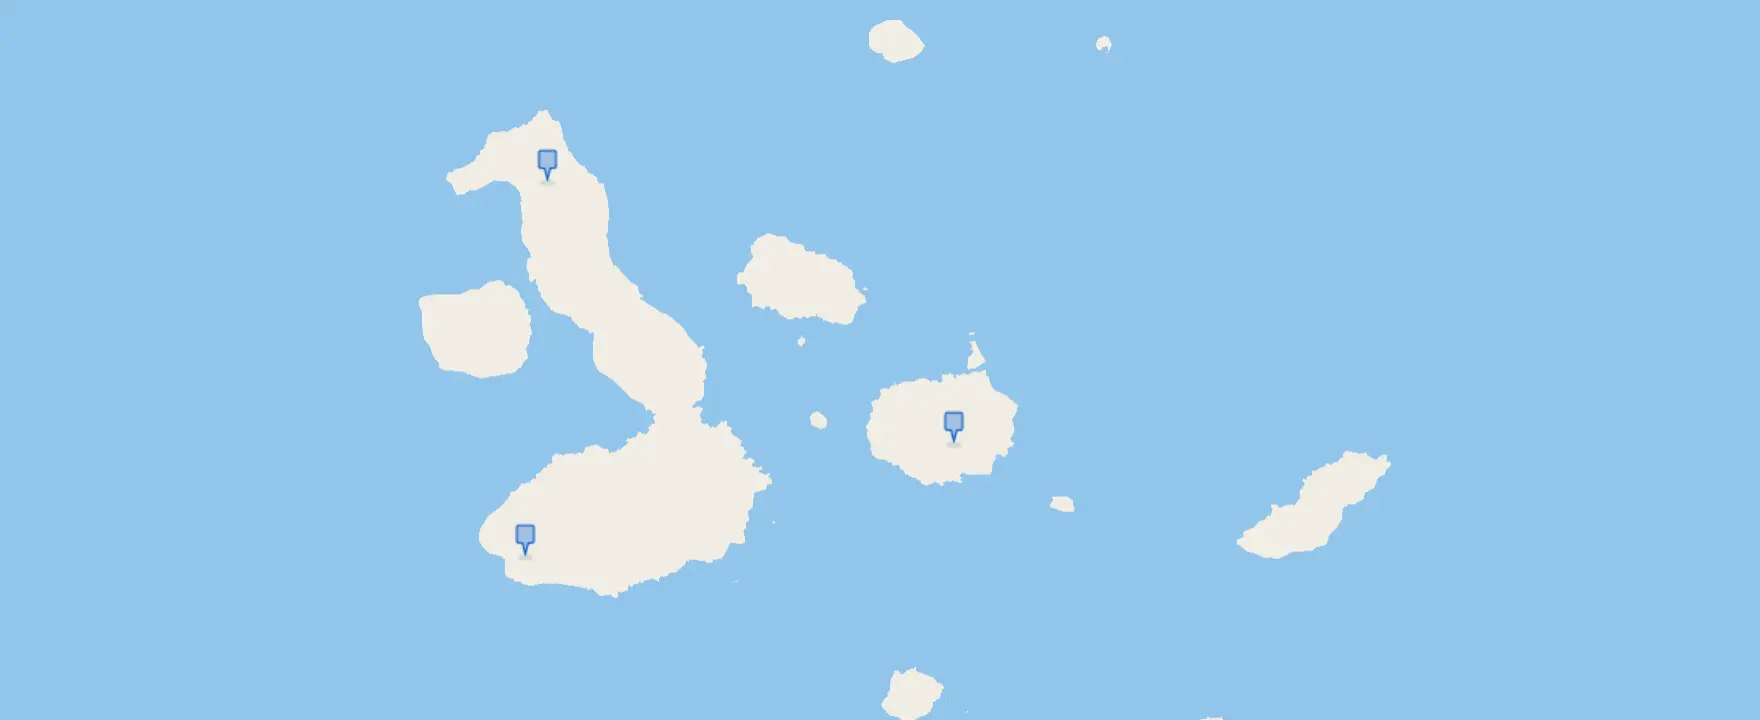
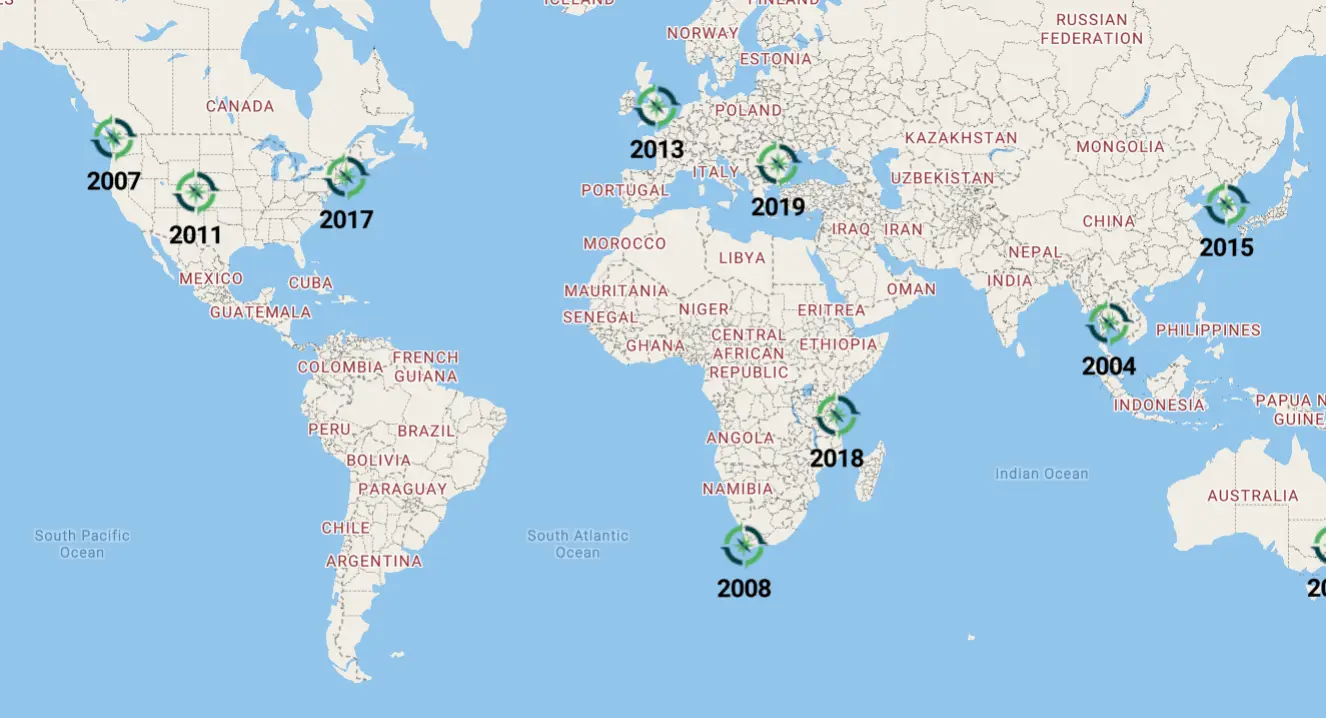
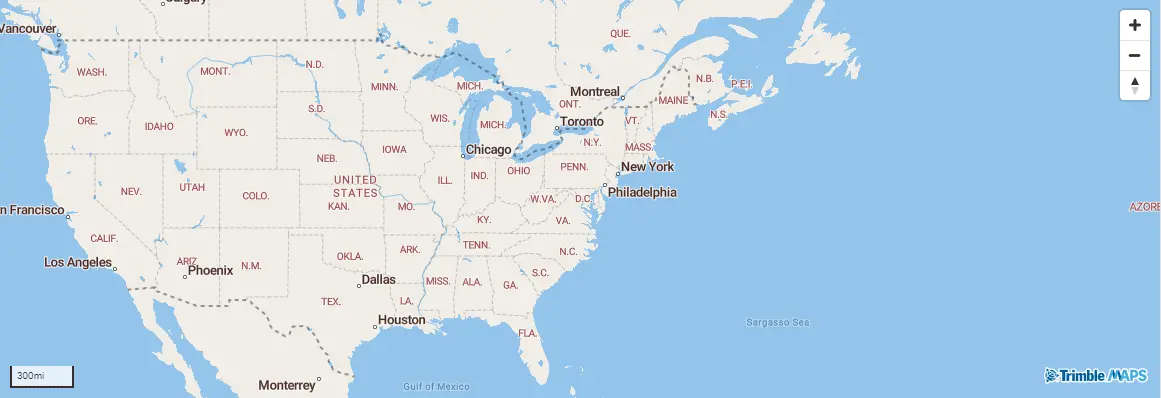
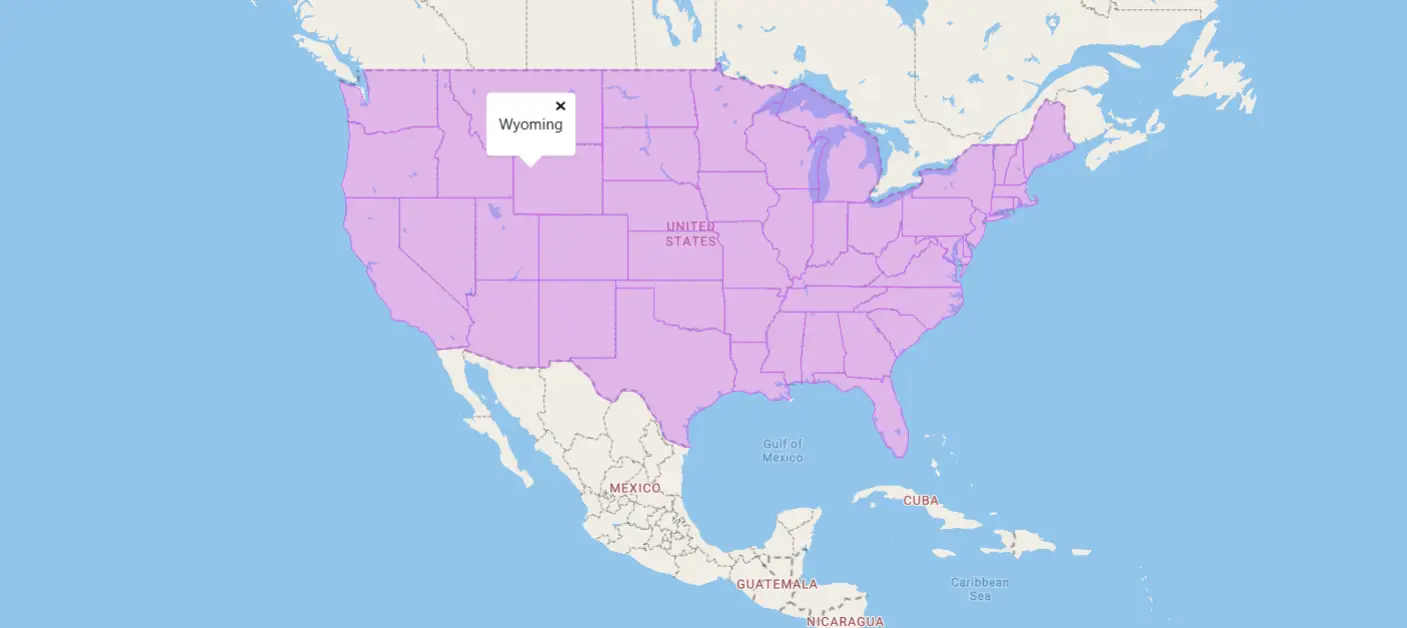
Jump to a series of locations
Use the jumpTo function to showcase multiple locations.
Jump to a series of locations
Use the jumpTo function to showcase multiple locations.
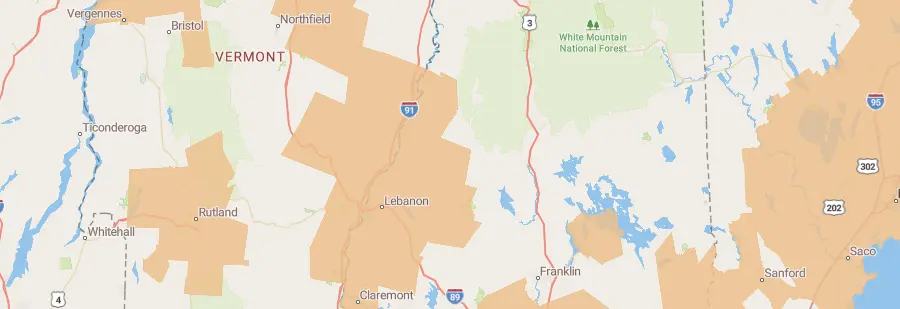
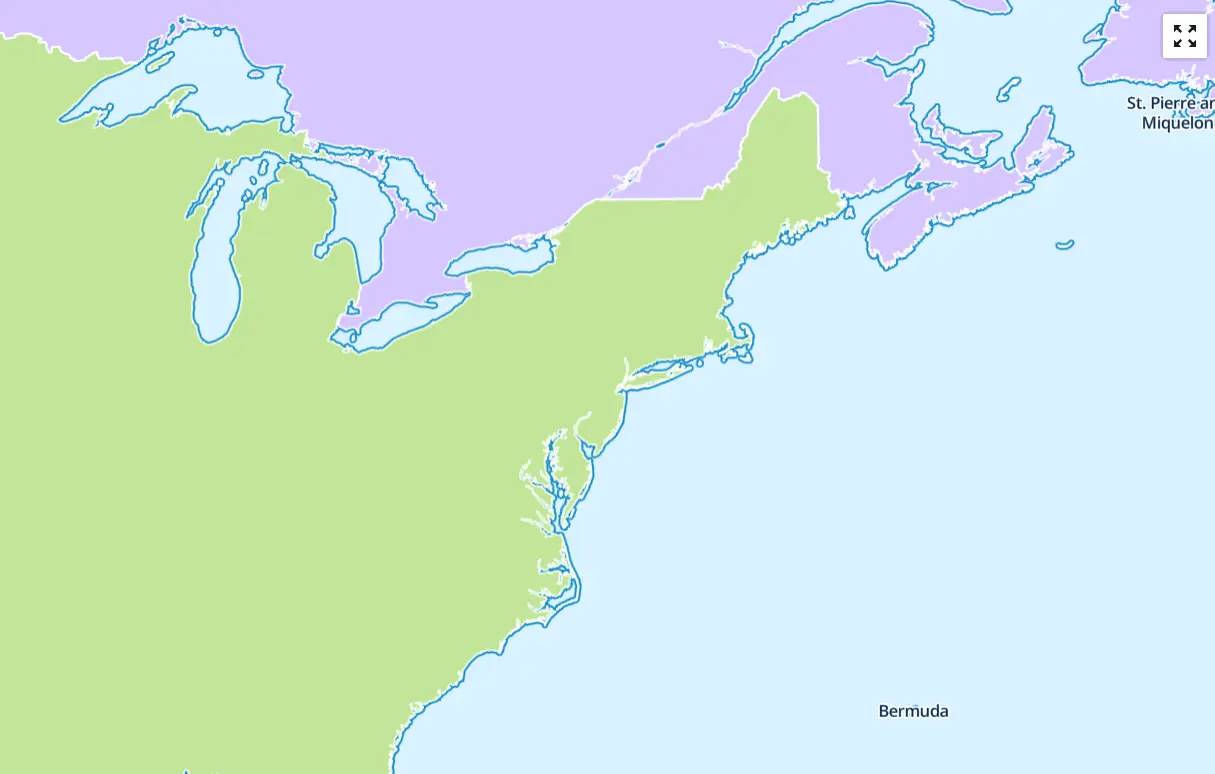
Layer Stacking
Add a new GeoJSON layer below the map’s labels. The New England City and Town Areas data source is from the United States Census Cartographic Boundary Files.
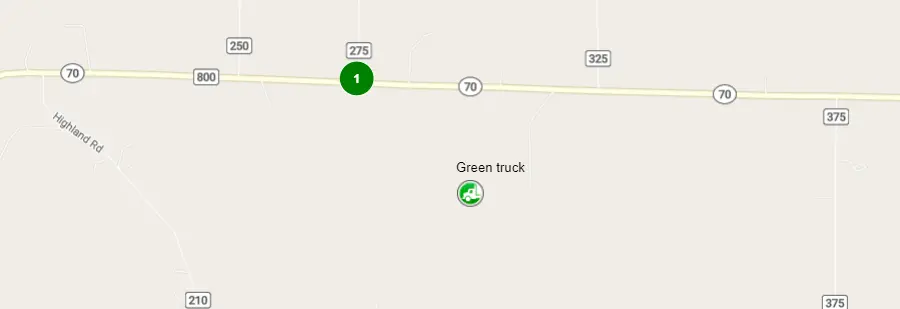
Live Feature Update
Shows the progression of a GPS track by adding new GPS points to a feature in a line layer. This feature could be used for visualizing real-time data sources.
Map Controls
Add navigation, scale, and full-screen controls to the map.
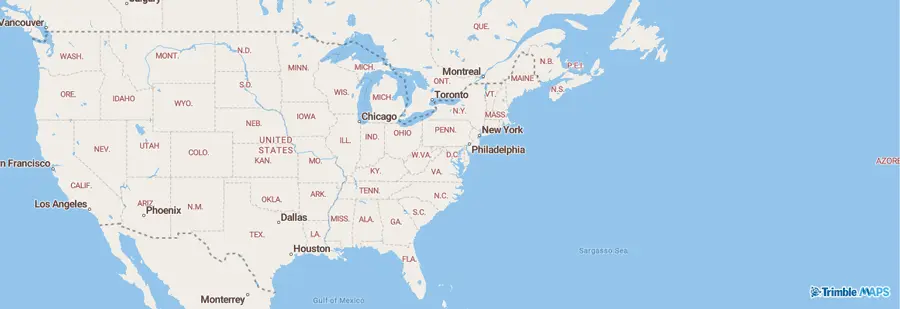
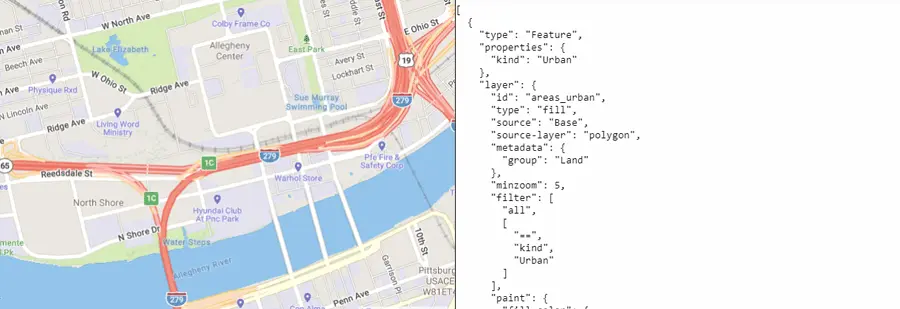
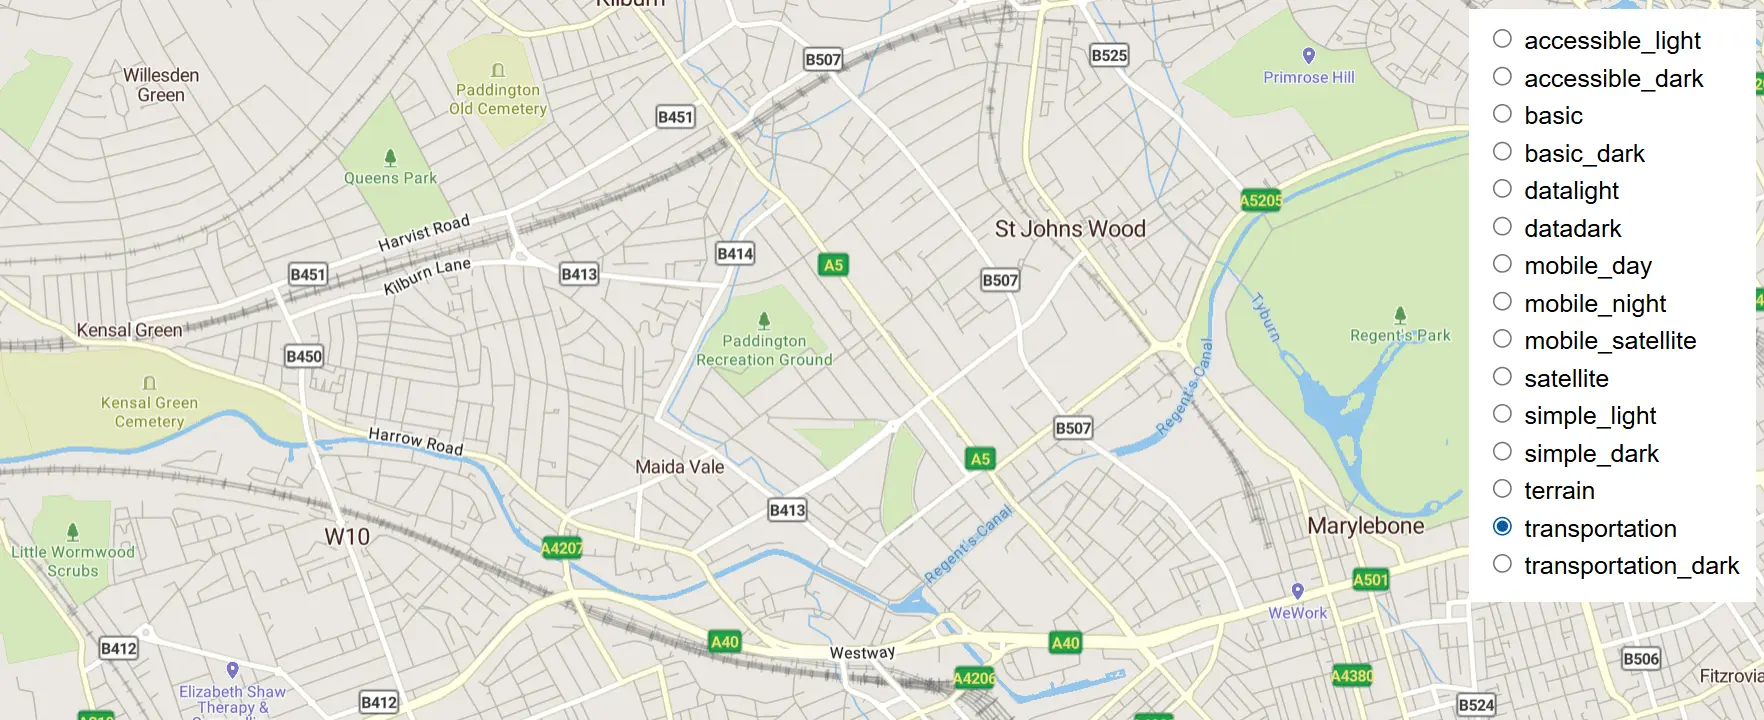
Map Styles
Map styles provide the visual styling for the map. The map style can be set when the map is initialized, and it can be changed using the setStyle function on a map object.
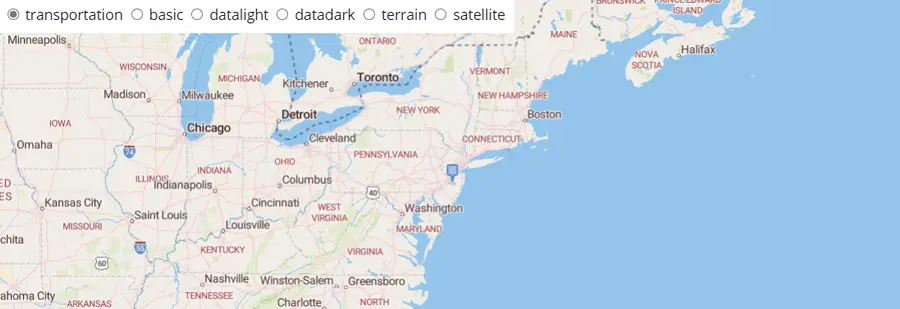
Map Styles (Europe)
Map styles provide the visual styling for the map. The map style can be set when the map is initialized, and it can be changed using the setStyle function on a map object.
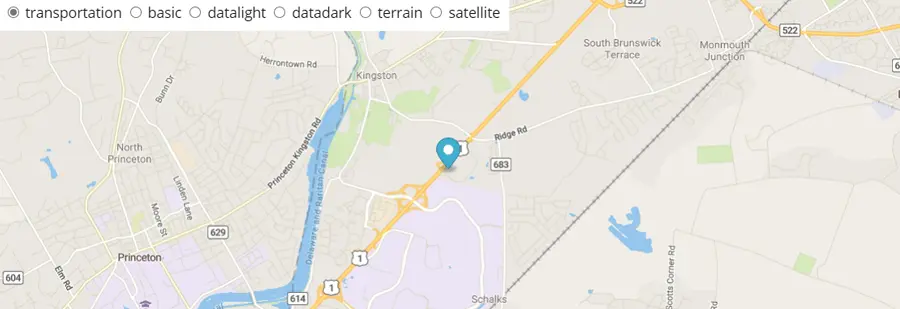
Map Styles Marker
With TrimbleMaps.Marker objects on the map, change map styles by calling the setStyle method.
Map Styles Symbol
Map styles with a symbol style marker layer on a styledata event.
MapMenu Add-on
Initialize a map with a Map Menu control.
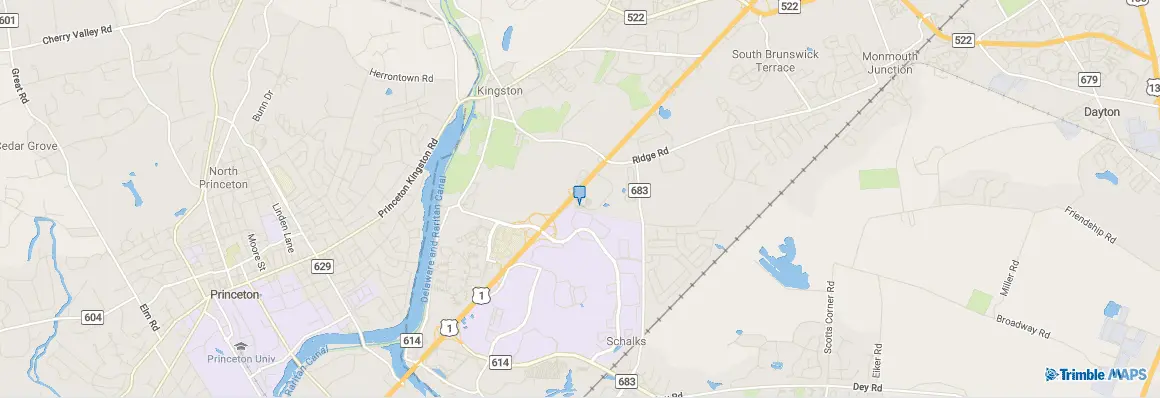
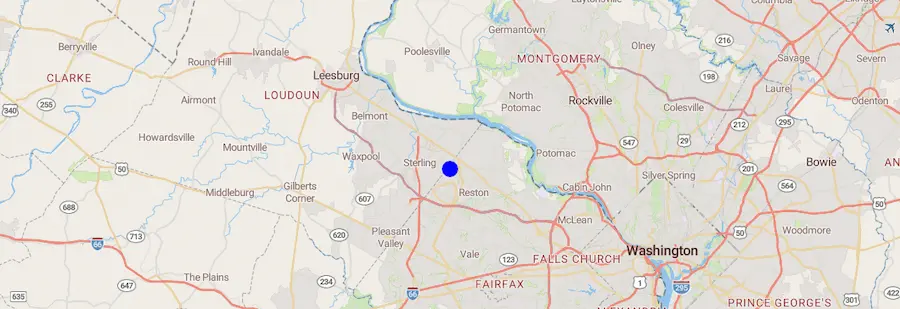
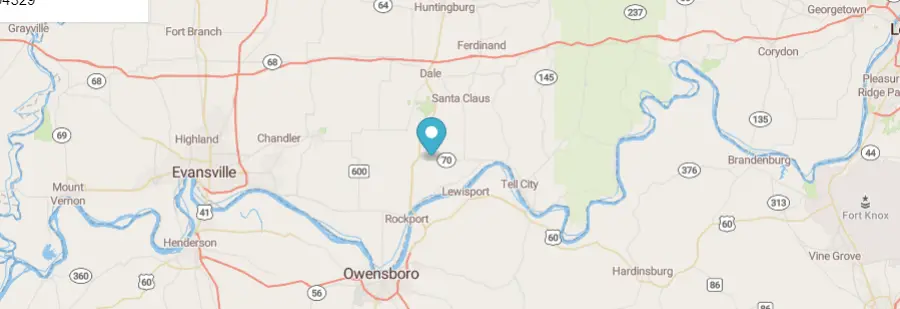
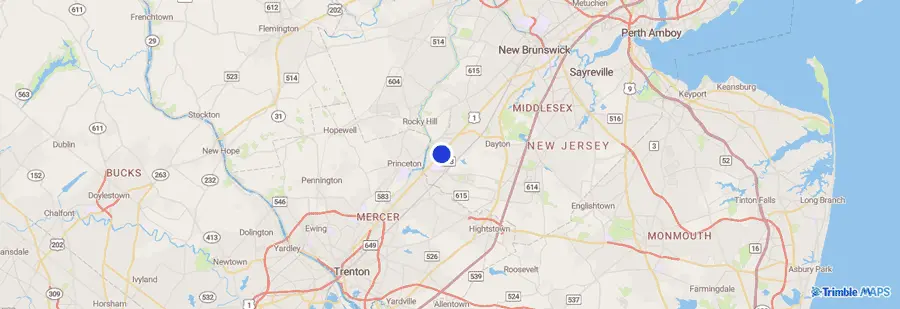
Marker and Popup
Add a custom marker to the map and show a popup when the marker is clicked. (Click on the blue pin in the center of the map below to out.).
Marker Styles
Marker styles change when you mouse over them.
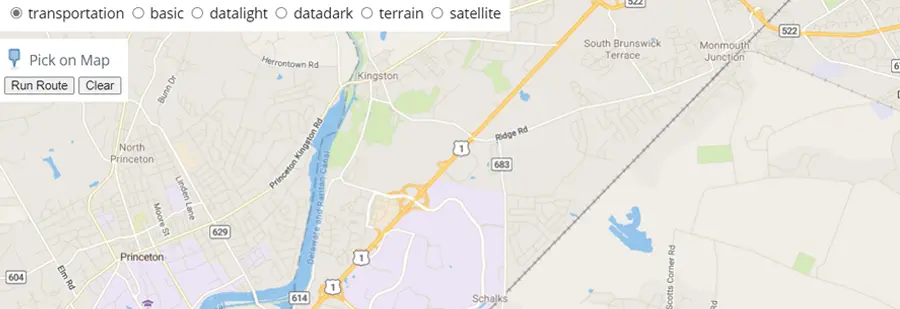
Markers and Routes
Click at least two locations on the map and then run routes between those locations.
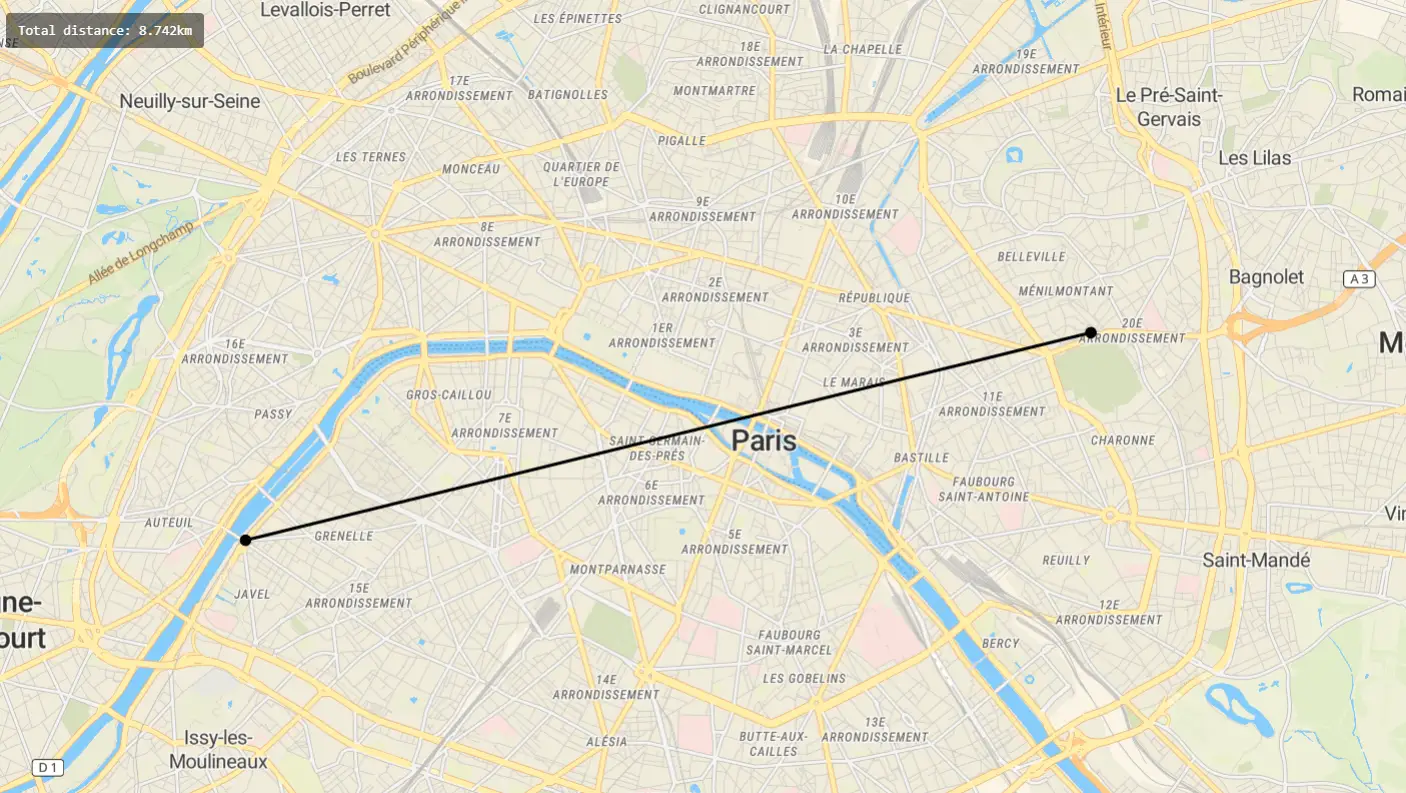
Measure distances
Click points on a map to create lines that measure distances using turf.length.
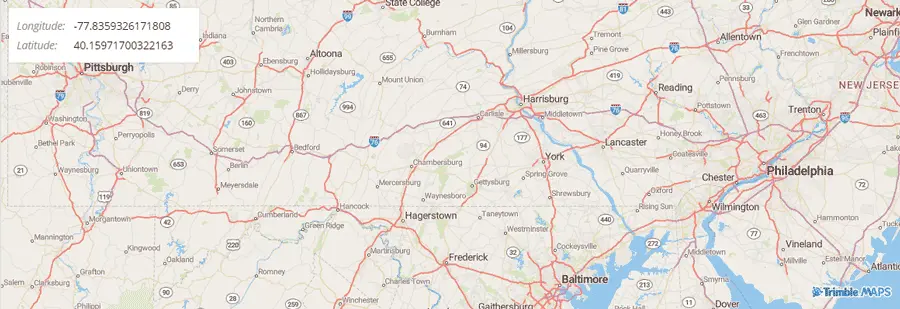
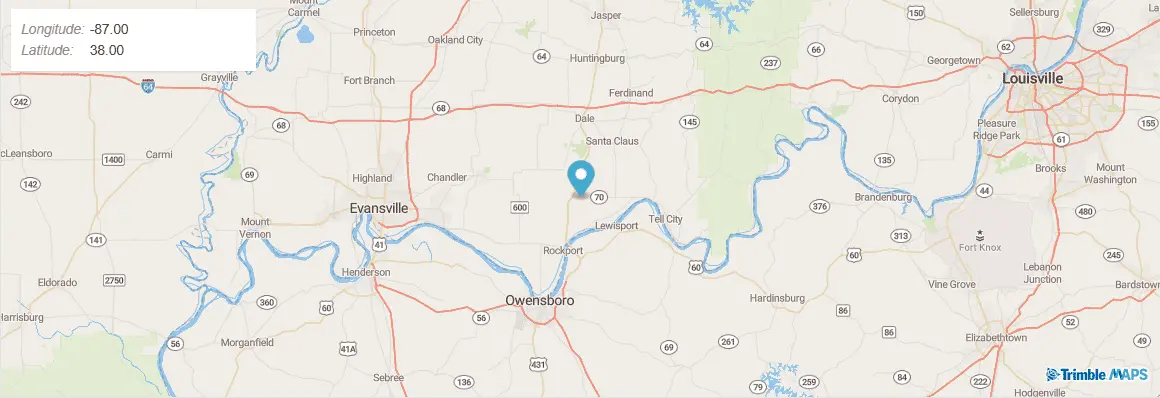
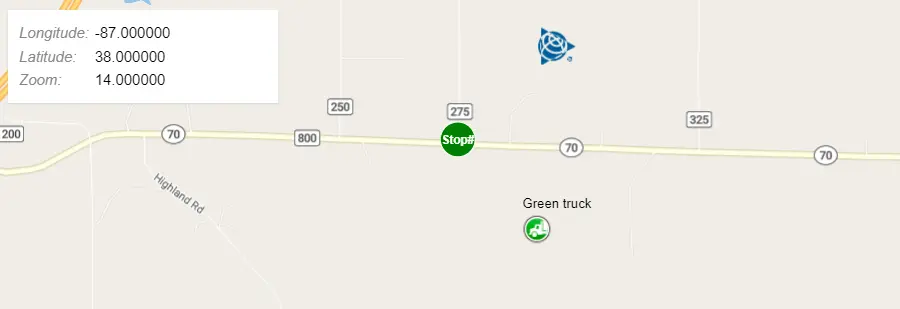
Mouse Position
Track the location of the mouse pointer as it moves around the map.
Navigate the map with game-like controls
Use the keyboard’s arrow keys to move around the map with game-like controls.
Polygon Popup on Click
When a user clicks a polygon, show a popup containing more information.
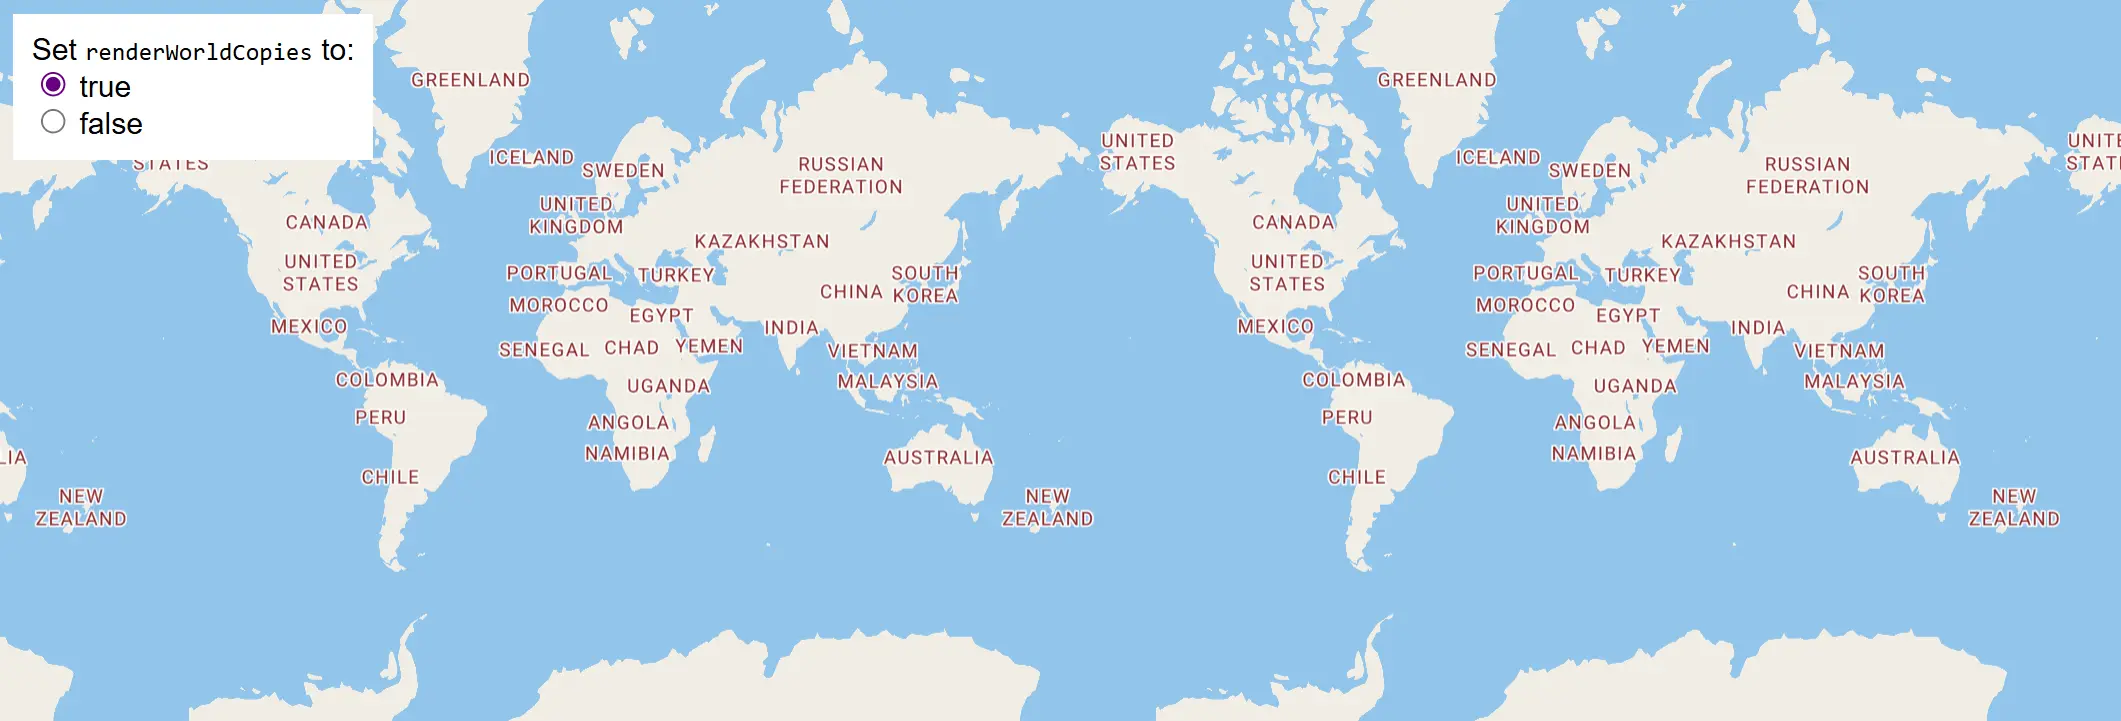
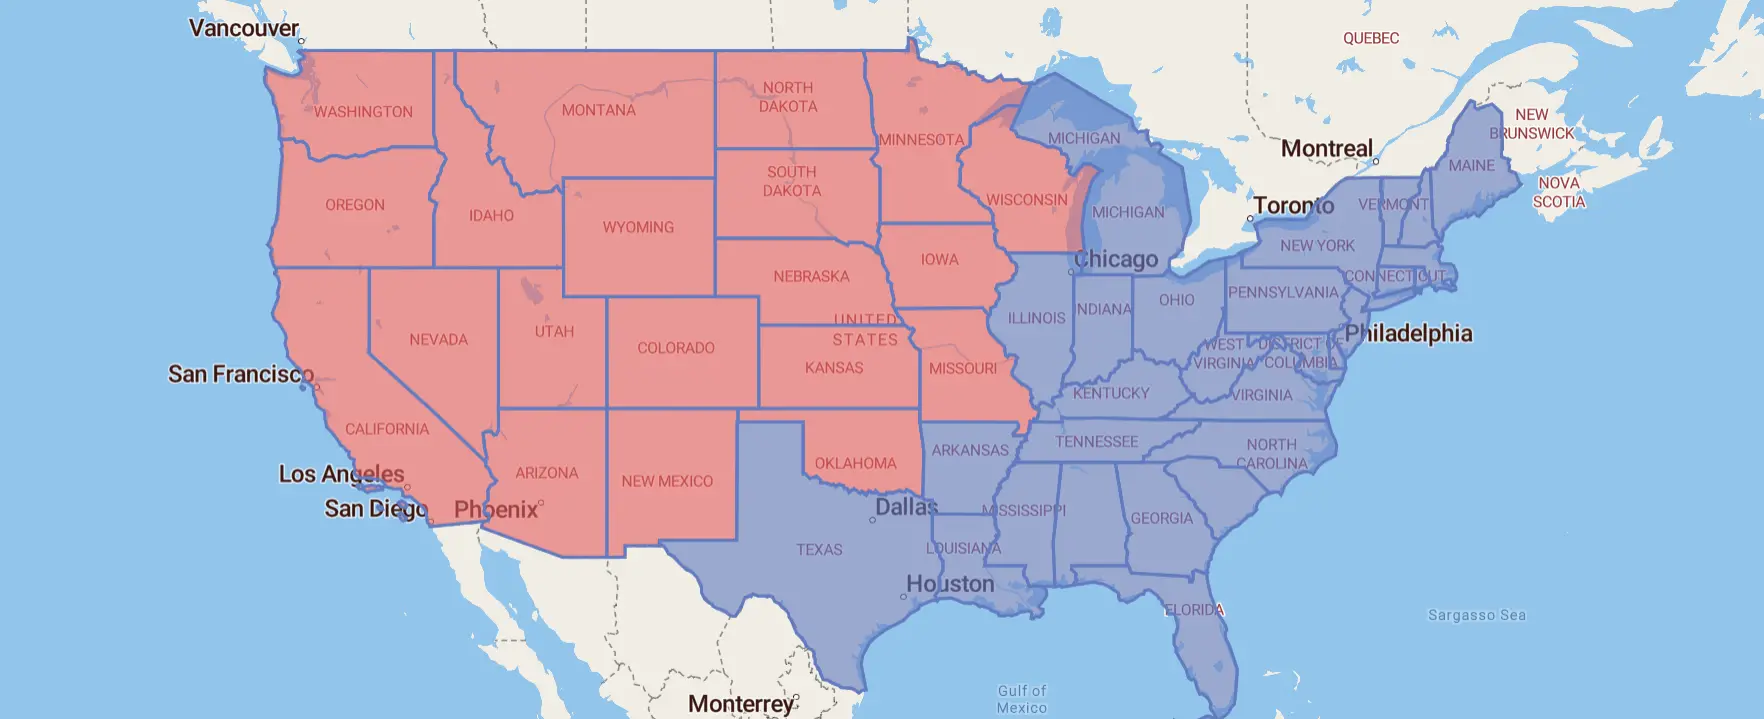
Render World Copies
Toggle between rendering a single world and multiple copies of the world using setRenderWorldCopies.
Rich Text
Display rich text labels using a format expression. Each input of the format expression should contain either a string literal or expression.
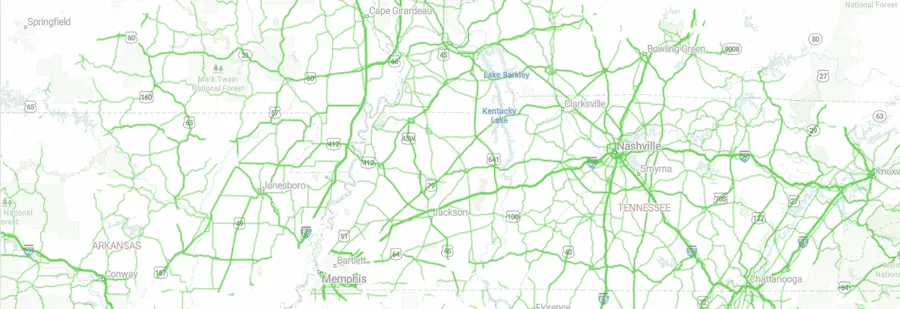
Road Surface
The road surface layer allows you to display road surface conditions as a map tile overlay. (North America only) Once this layer is added, it will display a road surface data overlay that is color-coded to indicate the condition of the roads currently visible on the map.
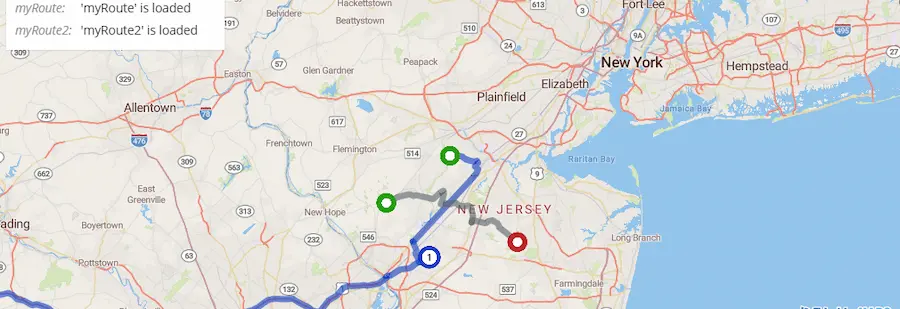
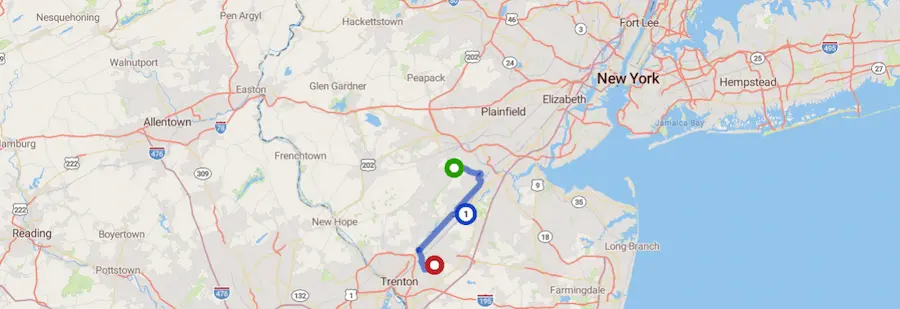
Route Event Handling
This demonstrates how to handle route events. There are two events provided by the SDK—routeloading, which fires as soon as the SDK begins working on a route, and route, which fires as soon as the route has been calculated and rendered.
Route Event Stop Inserting
When a route is altered by dragging, mouse down location could be on one or more route legs. Client app could utilize a stopInserting event listener to insert the stop on a selected leg.
Route Line Only
Show the route line only (no stop icons) when constructing a route by setting the showStops option to false.
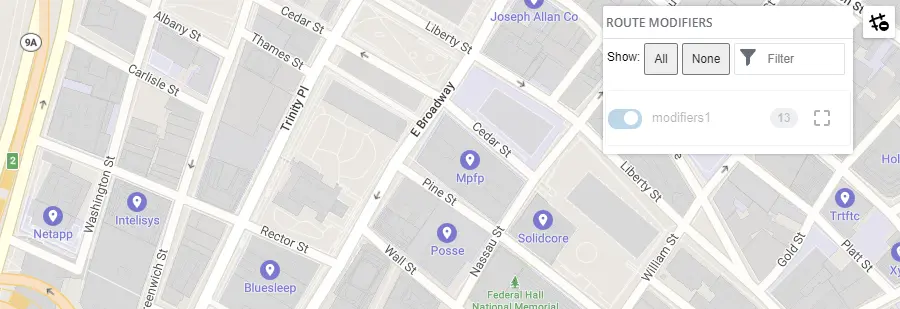
Route Modifiers
The Route Modifier layer allows you to indicate on a map roads that are configured for your company as avoids or favors. Avoids are roads that your company has designated should be avoided if at all possible.

Route Options
There are a variety of options available to customize the route. Please see the API documentation for descriptions of any of the options used in this .
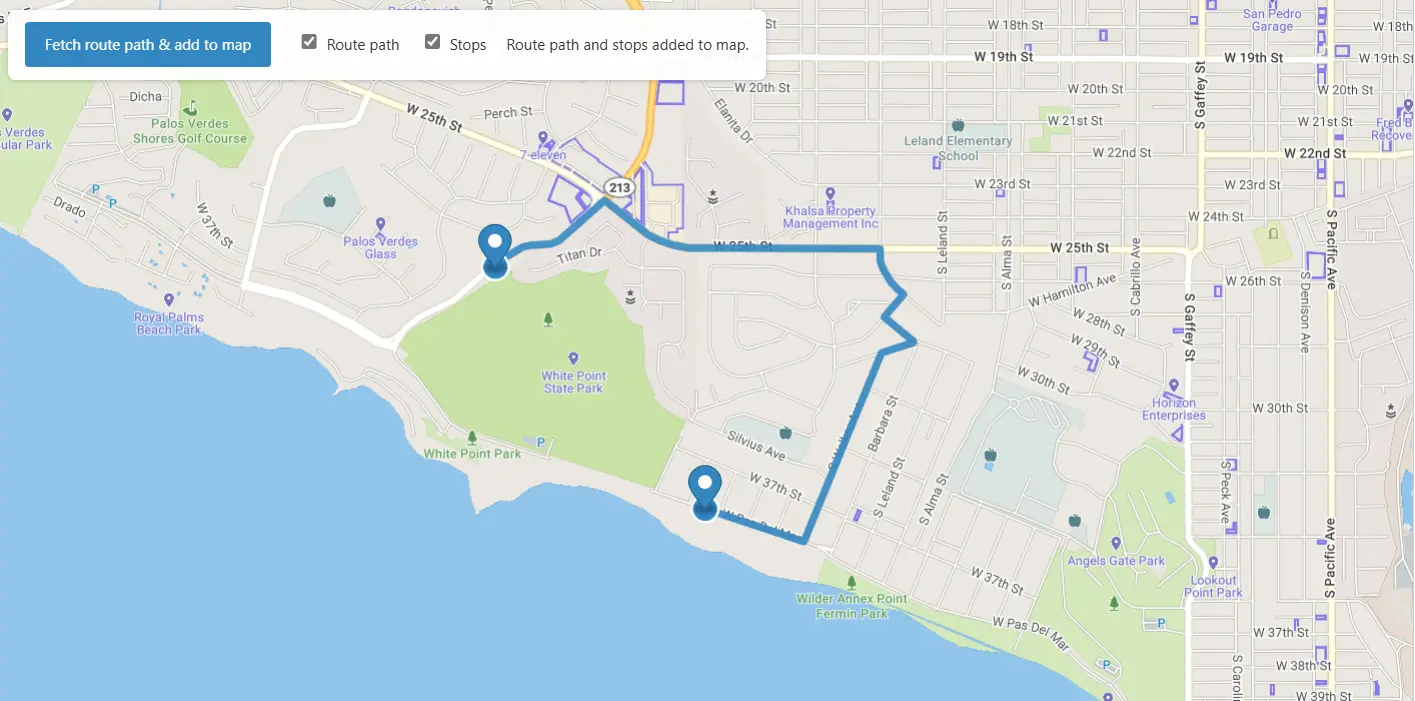
Route path report as map source and layer
Display a route path report as a map source and layer.
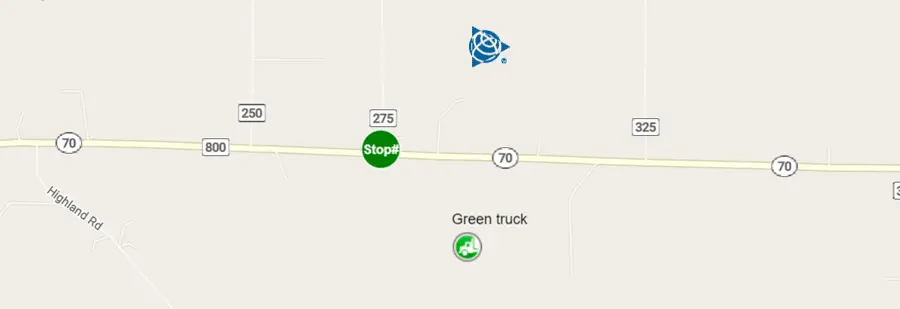
Route Stops Customization
If more control over route stops styling is desired, instead of using the update function, construct a route with showStops set to false, then add custom stops icons using the addStopIcon function and style them with the styleStopIcons function.
Route Styling
When a routing layer is constructed, the default route color, origin, destination, and stop icons will be used when routeColor, originIcon, destinationIcon, stopIcon route options are not provided. To change these default route properties, either supply custom a color and icons when constructing a layer or use the update function after a layer is created.
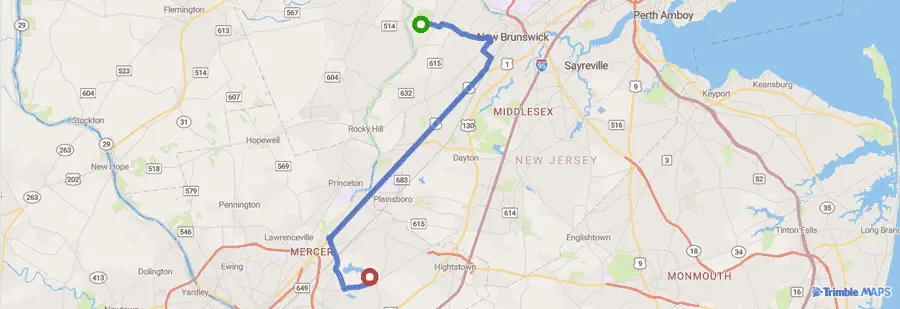
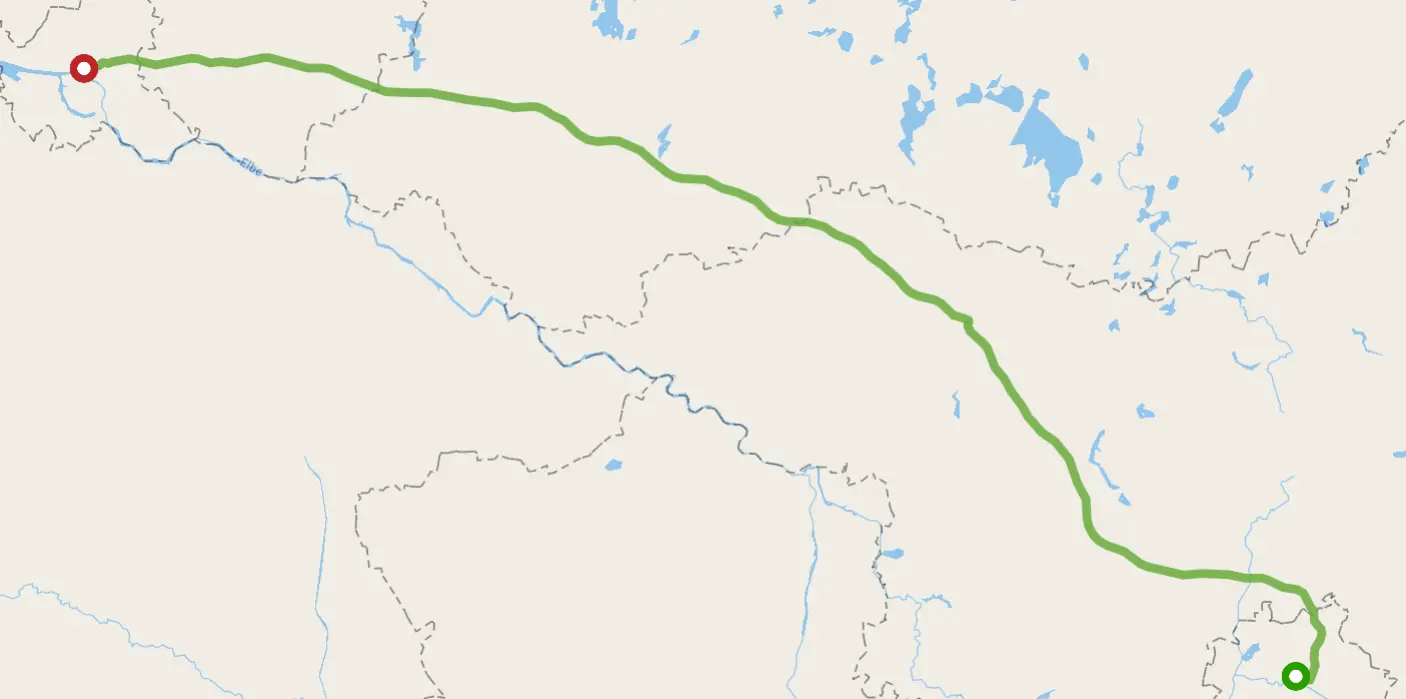
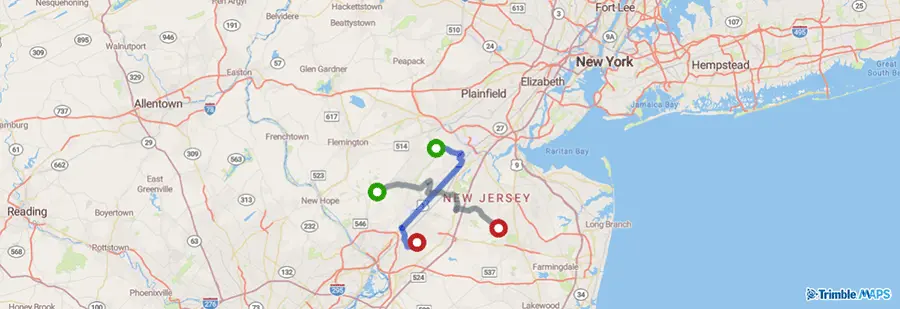
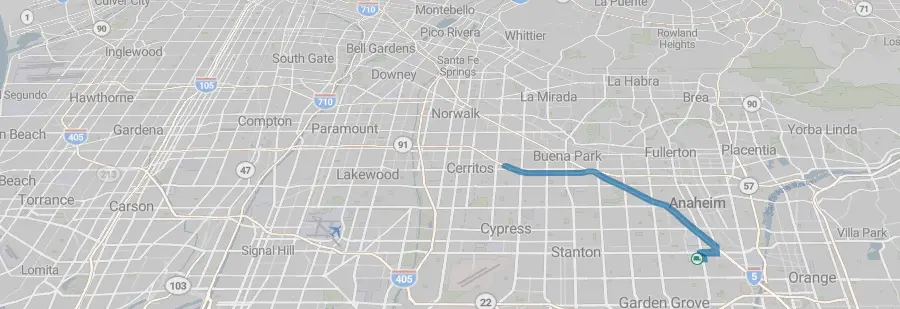
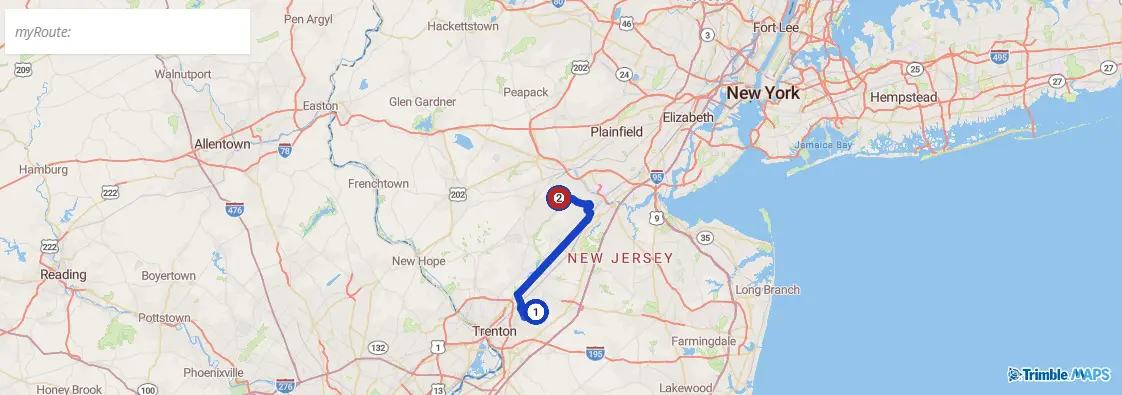
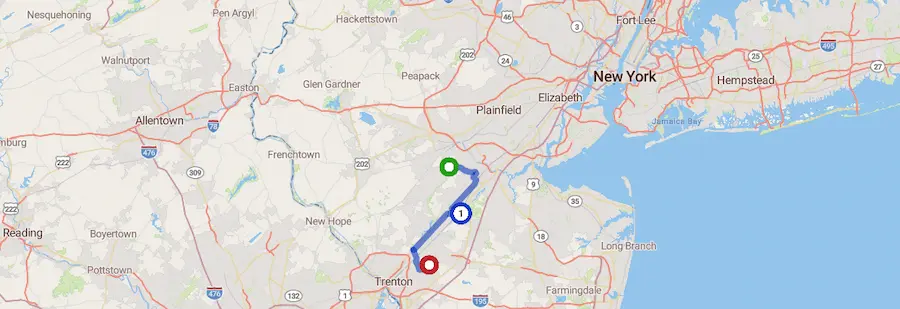
Routing
Display a route on the map.
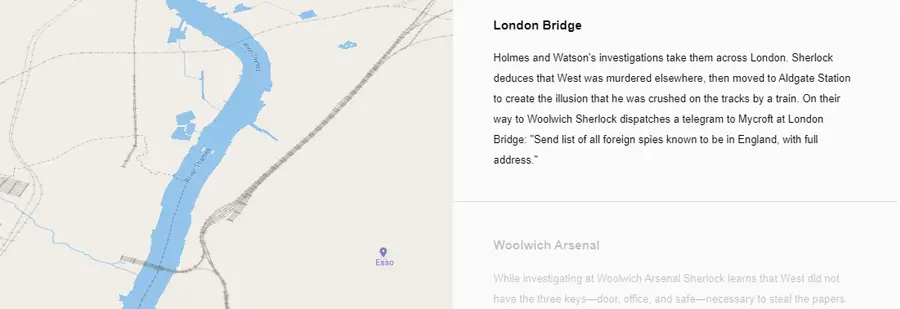
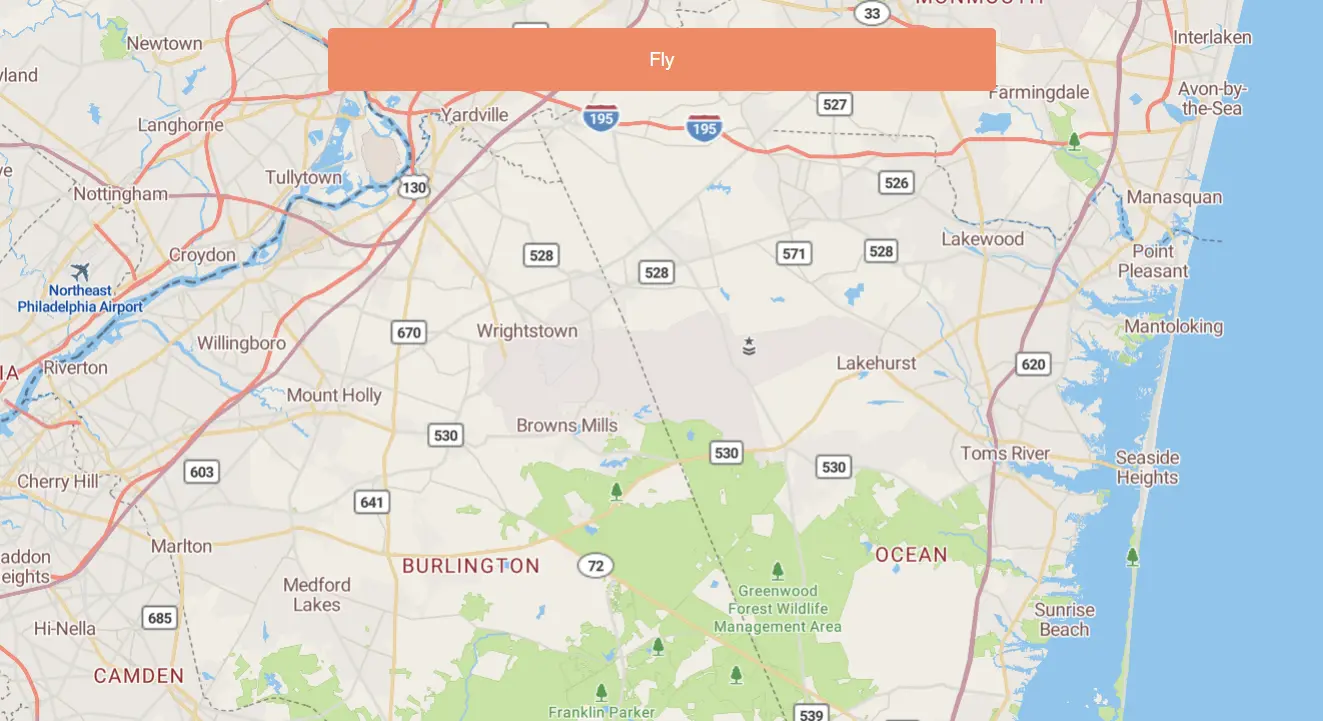
Scroll Fly To
Scroll down through the story and the map will fly to the chapter’s location.
Set pitch and bearing
Initialize a map with pitch and bearing camera options.
Set Popup
Attach a popup to a marker instance
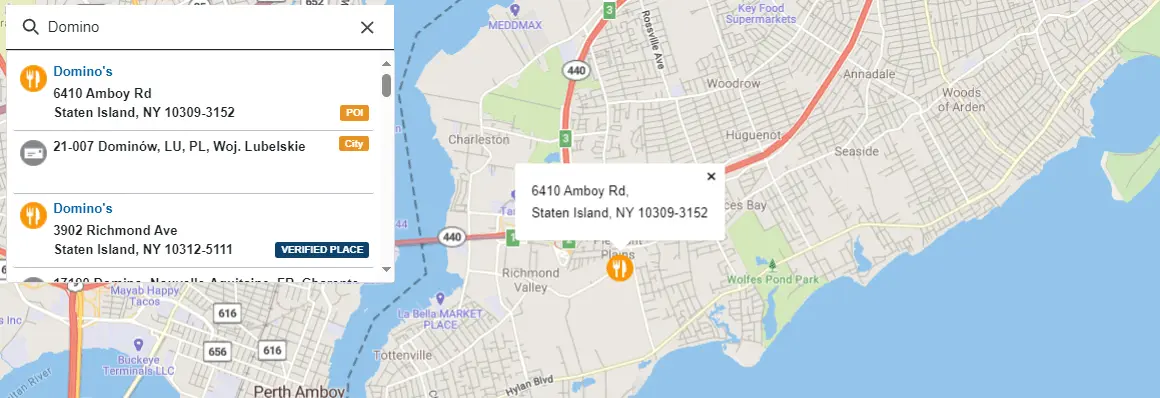
Single Search Add-on
Initialize a map with a Single Search control. Single Search allows the user to geocode a location entered as a single string of text.
Slowly fly to a location
Use flyTo with flyOptions to slowly zoom to a location.
Style Modifications
Make modifications to an existing map style.
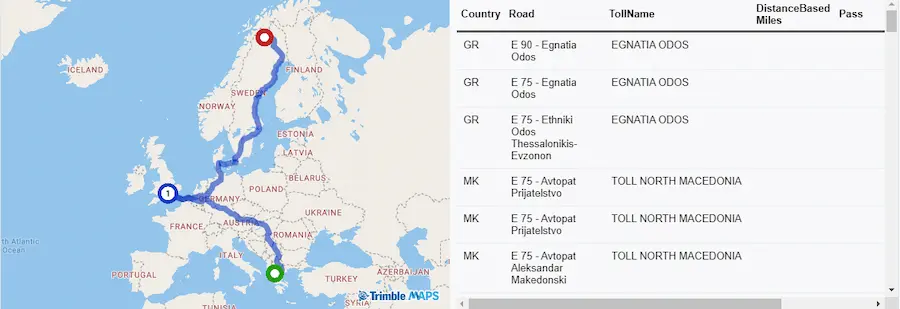
Toll Detail Report
This demonstrates how to get a Toll Detail Report for a route in Europe with route options trlType, trlCount, trlMaxHt, trlMaxWt, trlMaxAxles, isHybrid, emiType, minPoll.
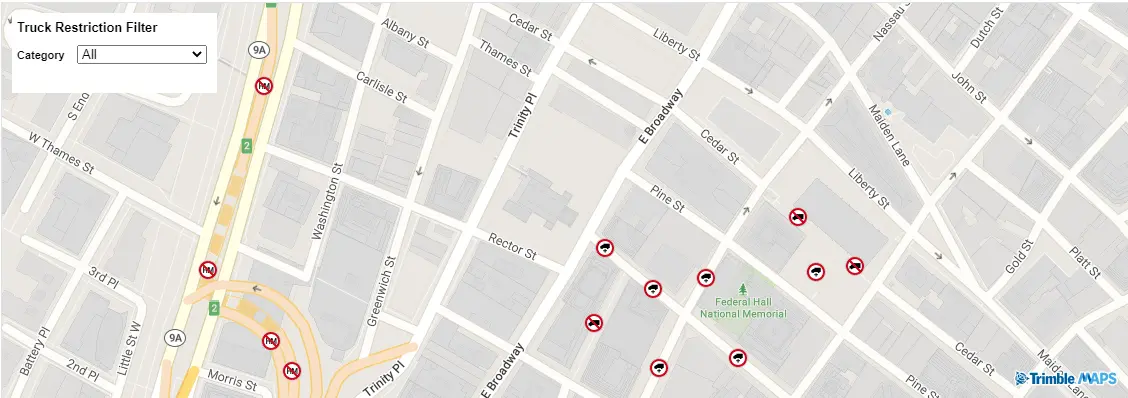
Truck Restrictions
The truck restrictions layer allows you to display truck restrictions on the map. By adding the TruckRestrictionClickControl, a pop-up message appears after clicking on a restriction.
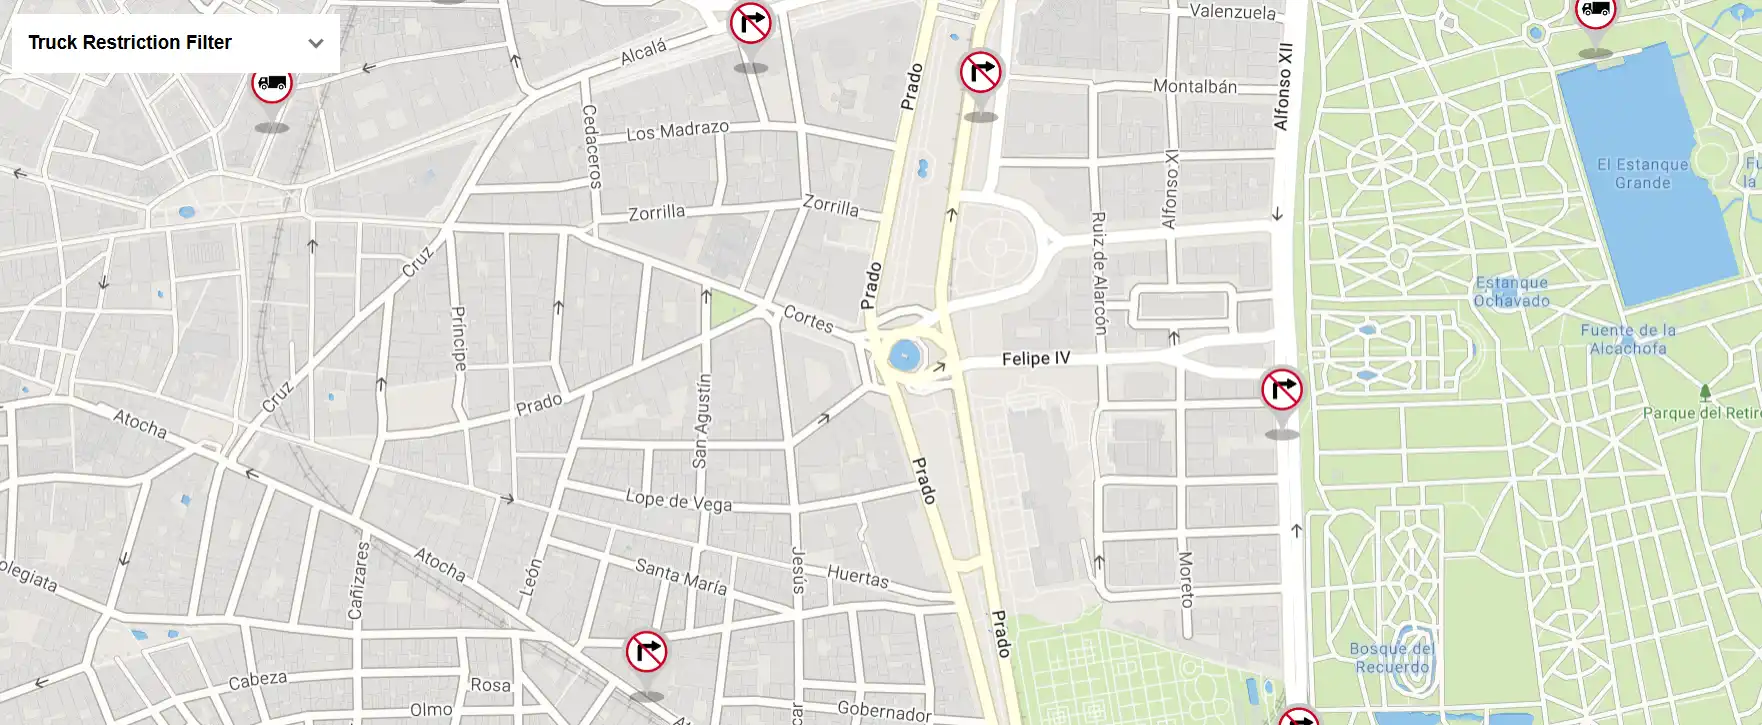
Truck Restrictions (Europe)
The truck restrictions layer allows you to display truck restrictions on the map. By adding the TruckRestrictionClickControl, a pop-up message appears after clicking on a restriction.
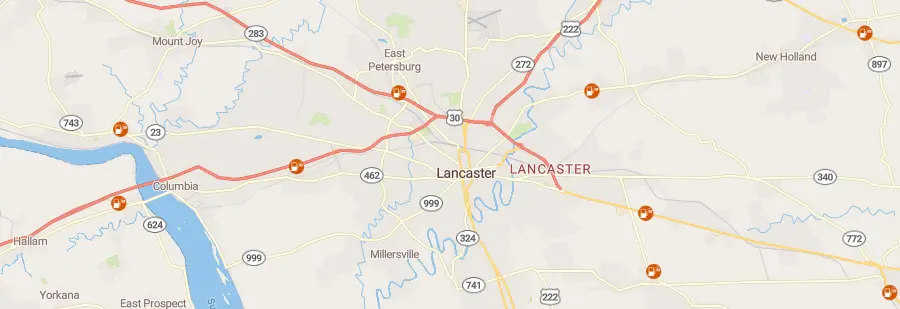
Truck Stops Layer Filter
Hide and show truck stop icons and labels. Change icon sizes.
Using Maps SDK with Azure
By default, maps are served from Amazon Web Services (AWS). This shows how you can instead serve maps from Microsoft’s Azure cloud platform.
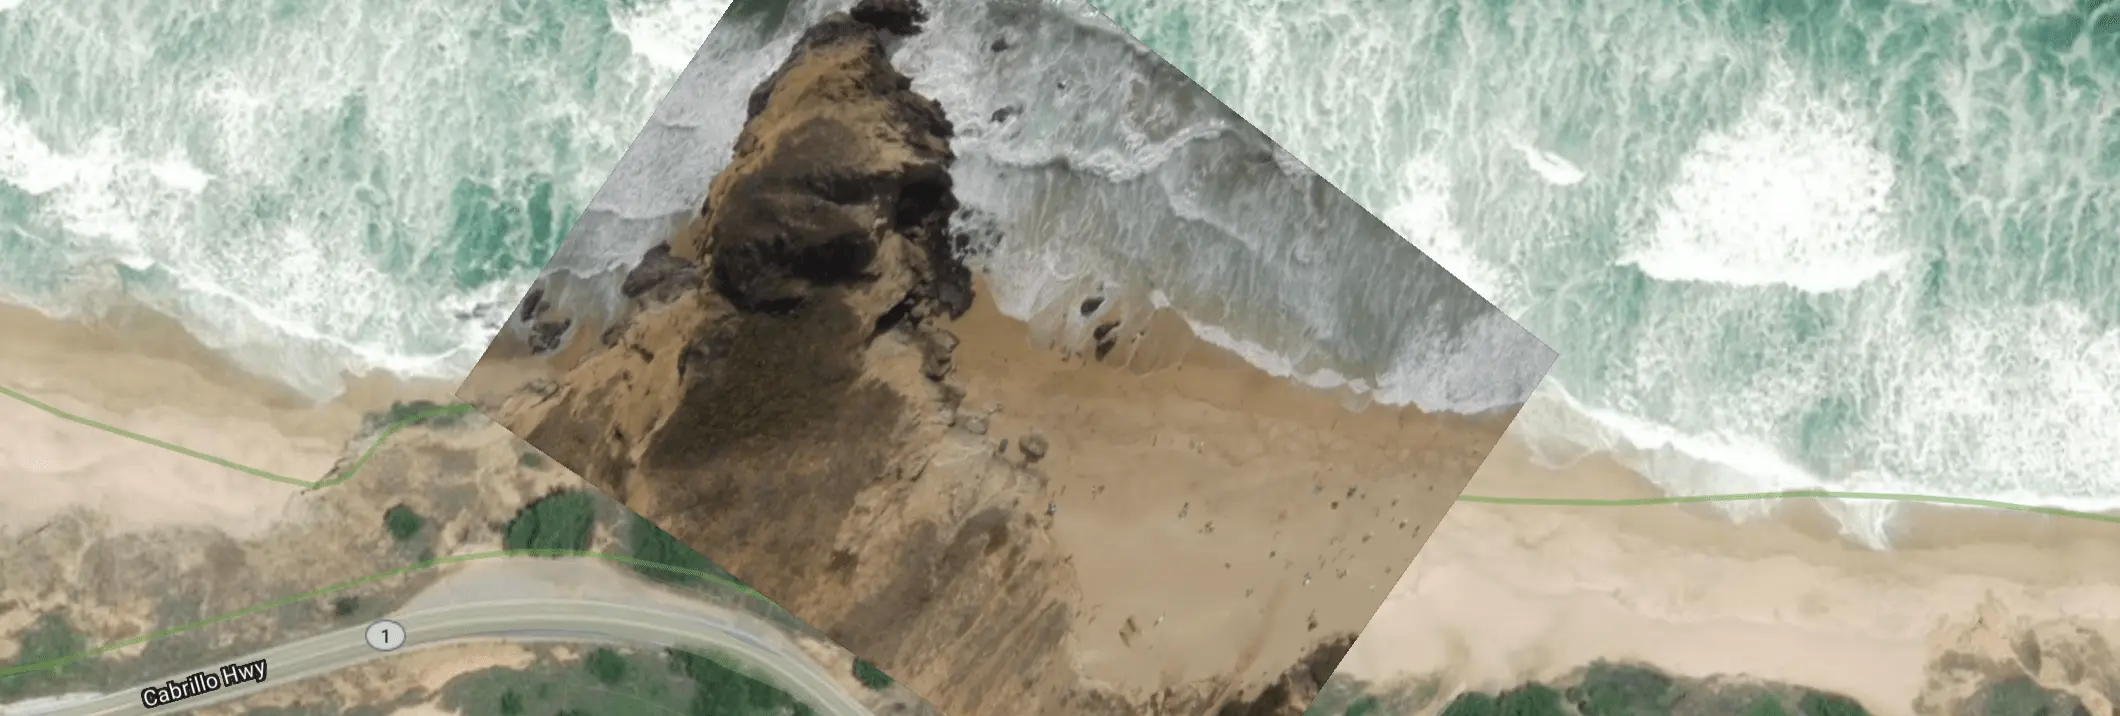
Video on a Map
Display a video on top of a satellite raster baselayer.
Walking Tracker
Animated Walking Tracker with Stats
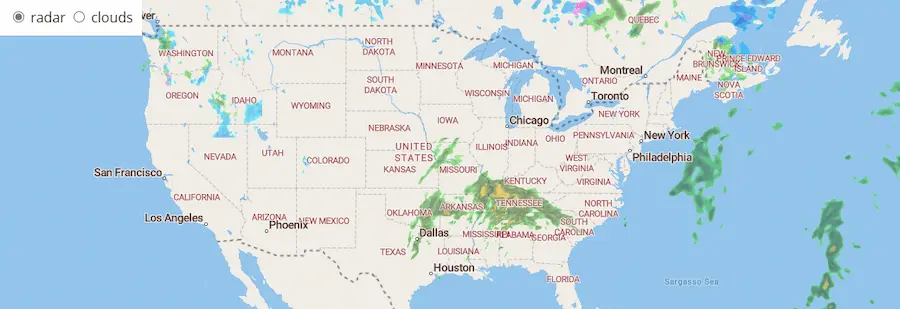
Weather
Weather layers allow you to dislay weather radar and satellite clouds data overlayed on the current map.
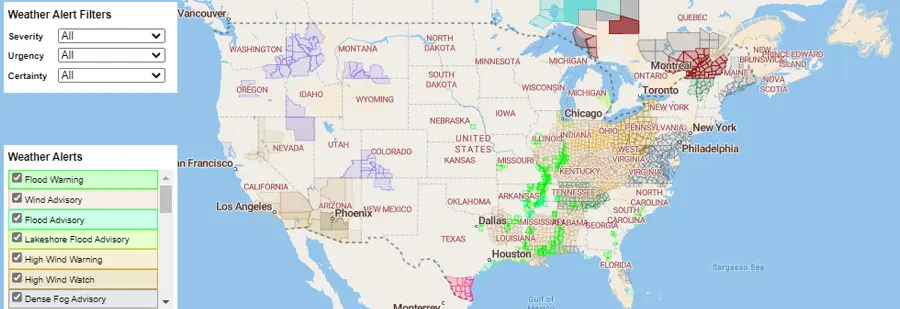
Weather Alerts
The weather alerts layer allows you to display weather alerts data on the map. (North America only) By adding the WeatherAlertClickControl, a weather alert message pop up shows after clicking on an alert.